The Ultimate Prompt Monitoring Pipeline
Welcome to Lesson 10 of 12 in our free course series, LLM Twin: Building Your Production-Ready AI Replica. You’ll learn how to use LLMs, vector DVs, and LLMOps best practices to design, train, and deploy a production ready “LLM twin” of yourself. This AI character will write like you, incorporating your style, personality, and voice into an LLM. For a full overview of course objectives and prerequisites, start with Lesson 1.
Lessons
- An End-to-End Framework for Production-Ready LLM Systems by Building Your LLM Twin
- Your Content is Gold: I Turned 3 Years of Blog Posts into an LLM Training
- I Replaced 1000 Lines of Polling Code with 50 Lines of CDC Magic
- SOTA Python Streaming Pipelines for Fine-tuning LLMs and RAG — in Real-Time!
- The 4 Advanced RAG Algorithms You Must Know to Implement
- Turning Raw Data Into Fine-Tuning Datasets
- 8B Parameters, 1 GPU, No Problems: The Ultimate LLM Fine-tuning Pipeline
- The Engineer’s Framework for LLM & RAG Evaluation
- Beyond Proof of Concept: Building RAG Systems That Scale
- The Ultimate Prompt Monitoring Pipeline
- [Bonus] Build a scalable RAG ingestion pipeline using 74.3% less code
- [Bonus] Build Multi-Index Advanced RAG Apps
This lesson will show you how to build a specialized prompt monitoring layer on top of your LLM Twin inference pipeline.
We will also show you how to compute evaluation metrics on top of your production data to alert us when we experience hallucinations, moderation, or other business-related issues while the system is in production.
In this lesson, you will learn the following:
- Why does having specialized software for monitoring LLM apps matter?
- How to implement a prompt monitoring layer for your complex traces.
- Build a monitoring evaluation pipeline to alarm you when the system degrades.
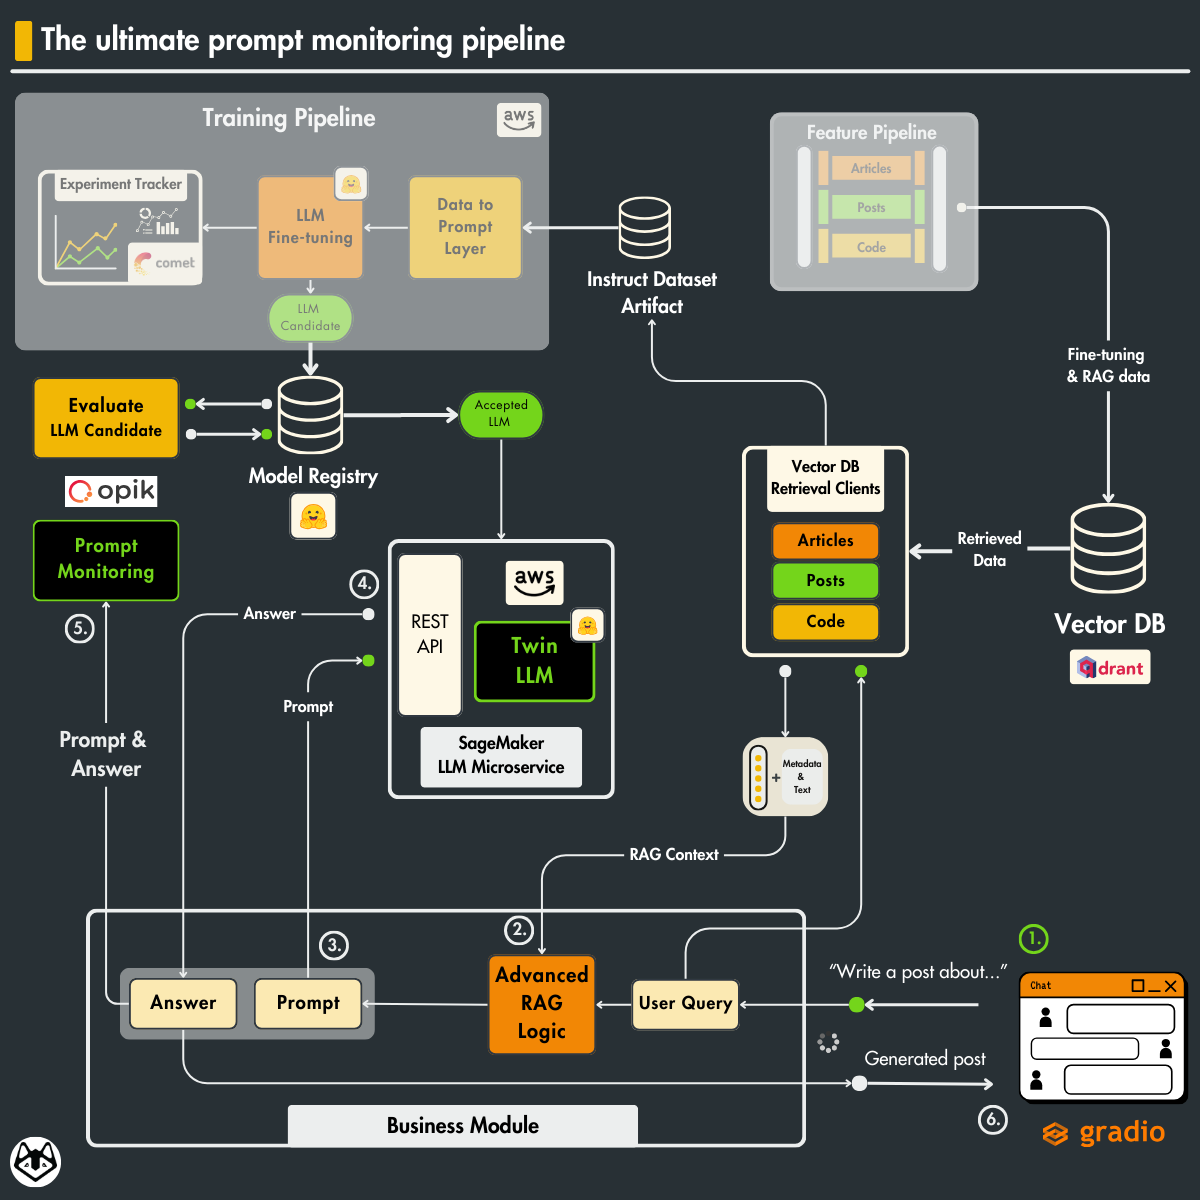
If you haven’t followed the rest of the LLM Twin series, to understand the particularities of our use case, we recommend you to read the following lessons:
You are good to go if you are here just for the monitor stuff. Enjoy!
Table of Contents
- Understanding the challenges of monitoring LLM apps
- Monitoring a simple LLM call with Opik
- Monitoring complex traces with Opik
- Sampling items for evaluating chains in production
- Evaluating chains in production
- Testing out the prompt monitoring service
🔗 Consider checking out the GitHub repository [1] and support us with a ⭐️
1. Understanding the challenges of monitoring LLM apps
Monitoring is not new to LLMOps, but in the LLM world, we have a new entity to manage: the prompt. Thus, we have to find specific ways to log and analyze them.
Most ML platforms such as Opik (by Comet), have implemented logging tools to debug and monitor prompts. In production, these tools are usually used to track user input, prompt templates, input variables, generated responses, token numbers, and latency.
When generating an answer with an LLM, we don’t wait for the whole answer to be generated; we stream the output token by token. This makes the entire process snappier and more responsive.
Thus, when it comes to tracking the latency of generating an answer, the final user experience must look at this from multiple perspectives, such as:
- Time to First Token (TTFT): The time it takes for the first token to be generated
- Time between Tokens (TBT): The interval between each token generation
- Tokens per Second (TPS): The rate at which tokens are generated
- Time per Output Token (TPOT): The time it takes to generate each output token
- Total Latency: The total time required to complete a response
Also, tracking the total input and output tokens is critical to understanding the costs of hosting your LLMs.
Before shipping a new model (or features) to production, it’s recommended that you compute all these latency metrics, along with others such as average input and output token length. To do so, you can use benchmarking open-source tools such as llmperf.
Ultimately, you can compute metrics that validate your model’s performance for each input, prompt, and output tuple. Depending on your use case, you can compute things such as accuracy, toxicity, and hallucination rate. When working with RAG systems, you can also compute metrics relative to the relevance and precision of the retrieved context.
Another essential thing to consider when monitoring prompts is to log their full traces. You might have multiple intermediate steps from the user query to the final general answer.
For example, rewriting the query to improve the RAG’s retrieval accuracy evolves one or more intermediate steps. Thus, logging the full trace reveals the entire process from when a user sends a query to when the final response is returned, including the actions the system takes, the documents retrieved, and the final prompt sent to the model.
Additionally, you can log the latency, tokens, and costs at each step, providing a more fine-grained view of all the steps.
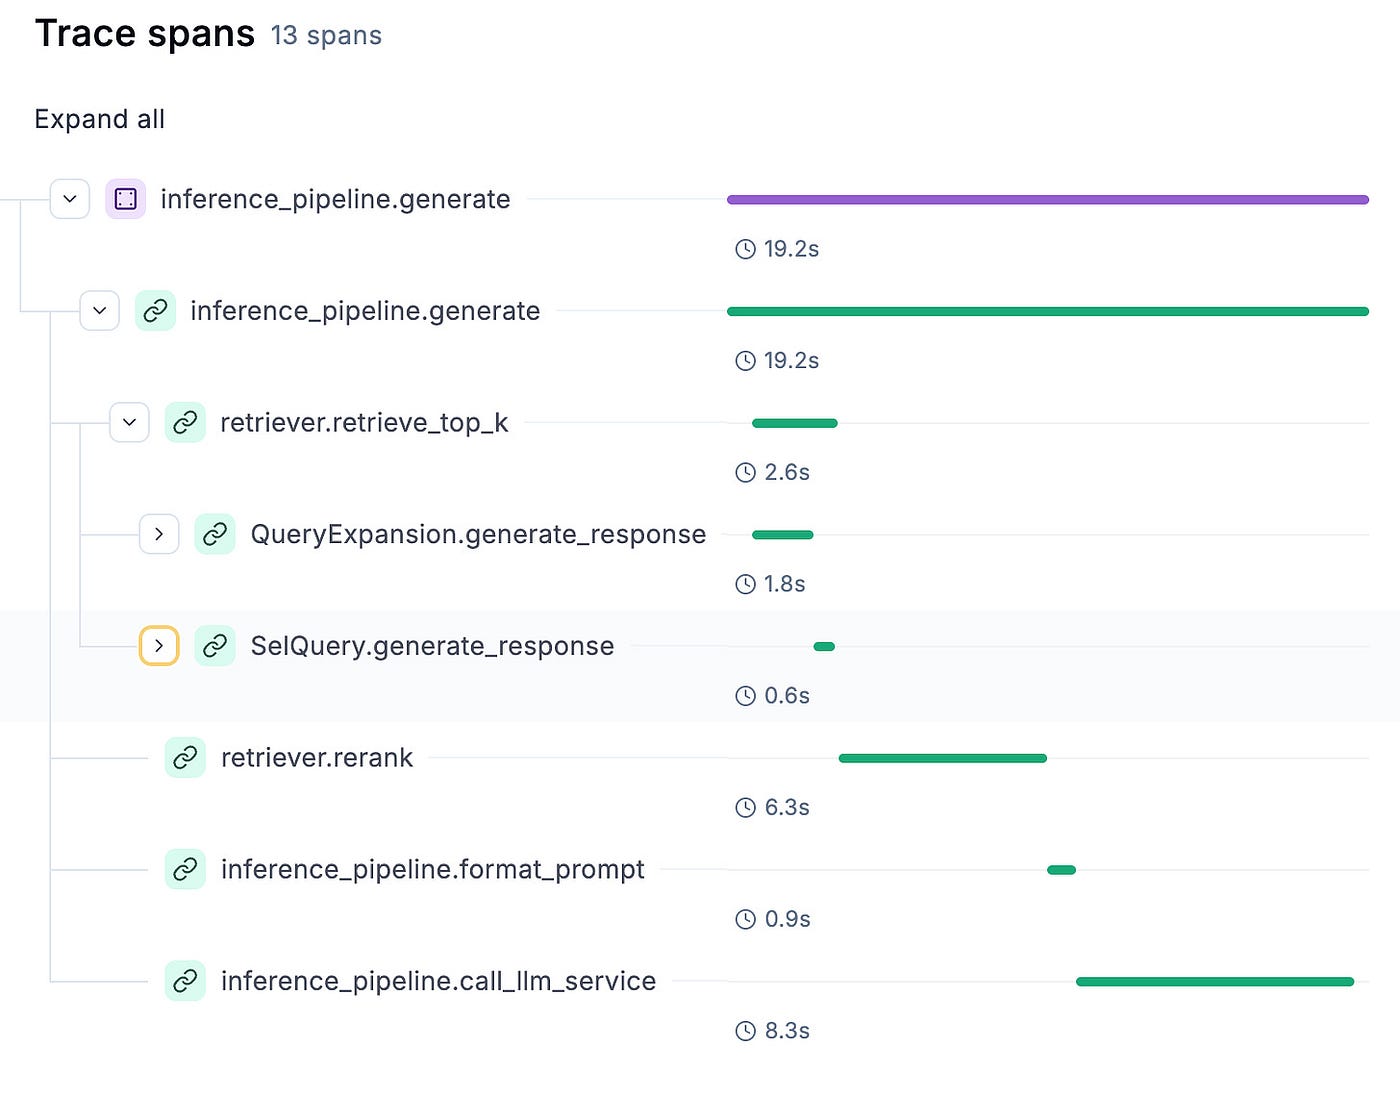
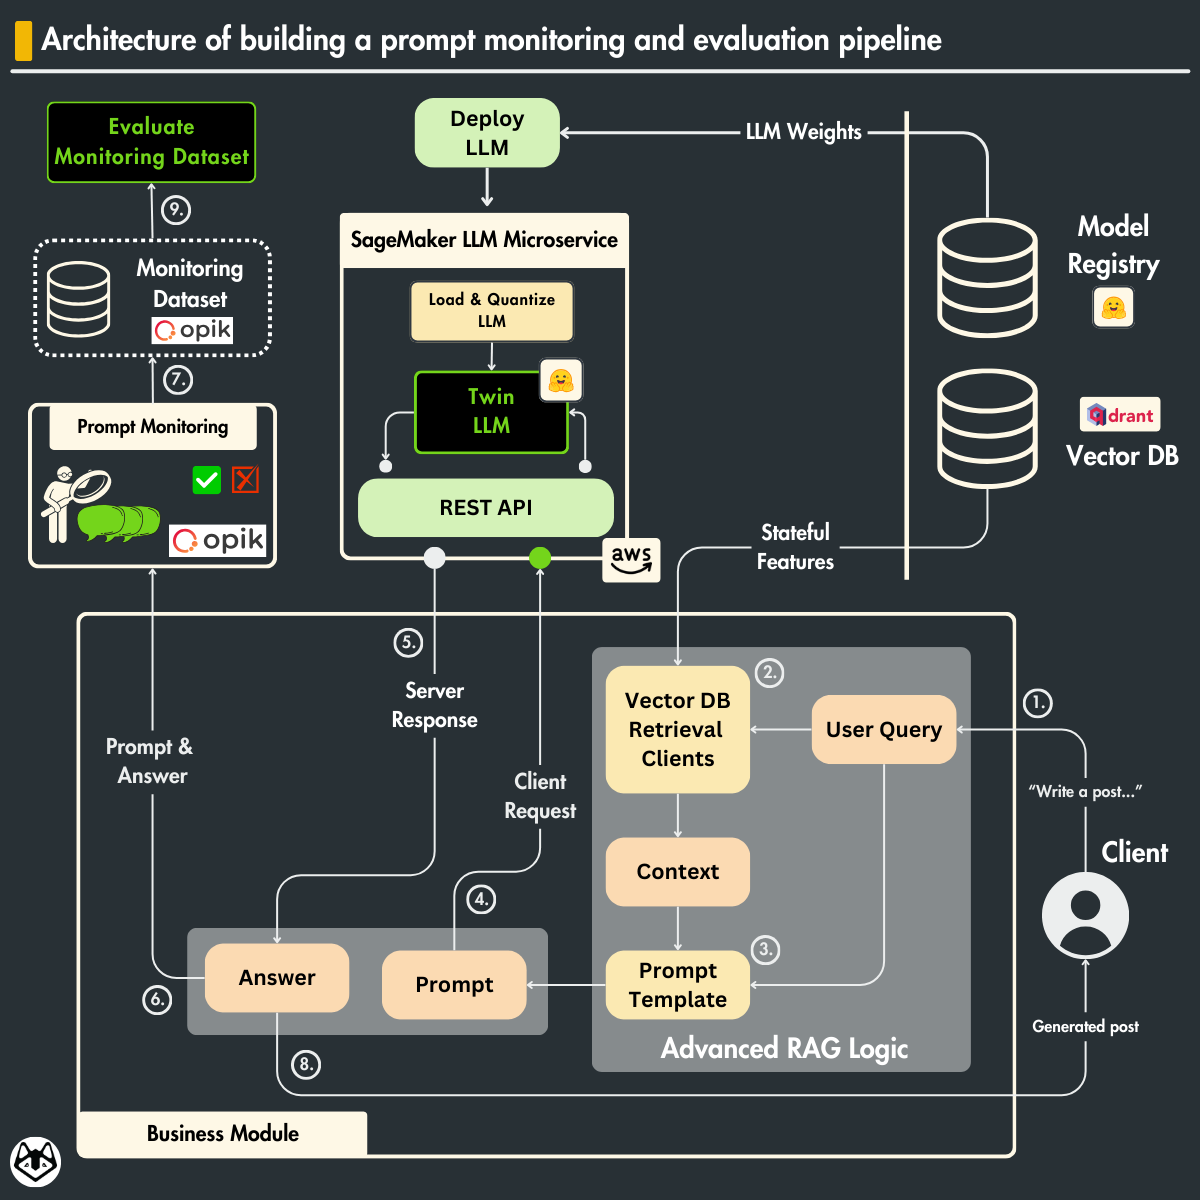
As shown in Figure 1, the end goal is to trace each step from the user’s input until the generated answer. If something fails or behaves unexpectedly, you can point exactly to the faulty step. The query can fail due to an incorrect answer, an invalid context, or incorrect data processing. Also, the application can behave unexpectedly if the number of generated tokens suddenly fluctuates during specific steps.
2. Monitoring a simple LLM call
We will use Opik to implement the prompt monitoring layer.
We have also used Opik in Lesson 8 for LLM & RAG evaluation, as Opik’s mission is to build an open-source Python tool for end-to-end LLM development (backed up by Comet).
The first step in understanding their monitoring Python SDK is to know how to monitor a simple LLM call.
When working with custom APIs
To do so, when we must annotate the function with the @opik.track(name=”…”) Python decorator.
The name parameter is useless when logging a single prompt, but it is beneficial when logging traces with multiple prompts. It helps you structure your monitoring strategy and quickly identify the issue.
 import opik

@opik.track(name="inference_pipeline.call_llm_service")
def call_llm_service(messages: list[dict[str, str]]) -> str:
answer = self._llm_endpoint.predict(
data={
"messages": messages,
"parameters": {
"max_new_tokens": settings.MAX_TOTAL_TOKENS
- settings.MAX_INPUT_TOKENS,
"temperature": 0.01,
"top_p": 0.6,
"stop": ["<|eot_id|>"],
"return_full_text": False,
},
}
)
answer = answer["choices"][0]["message"]["content"].strip()

return answer
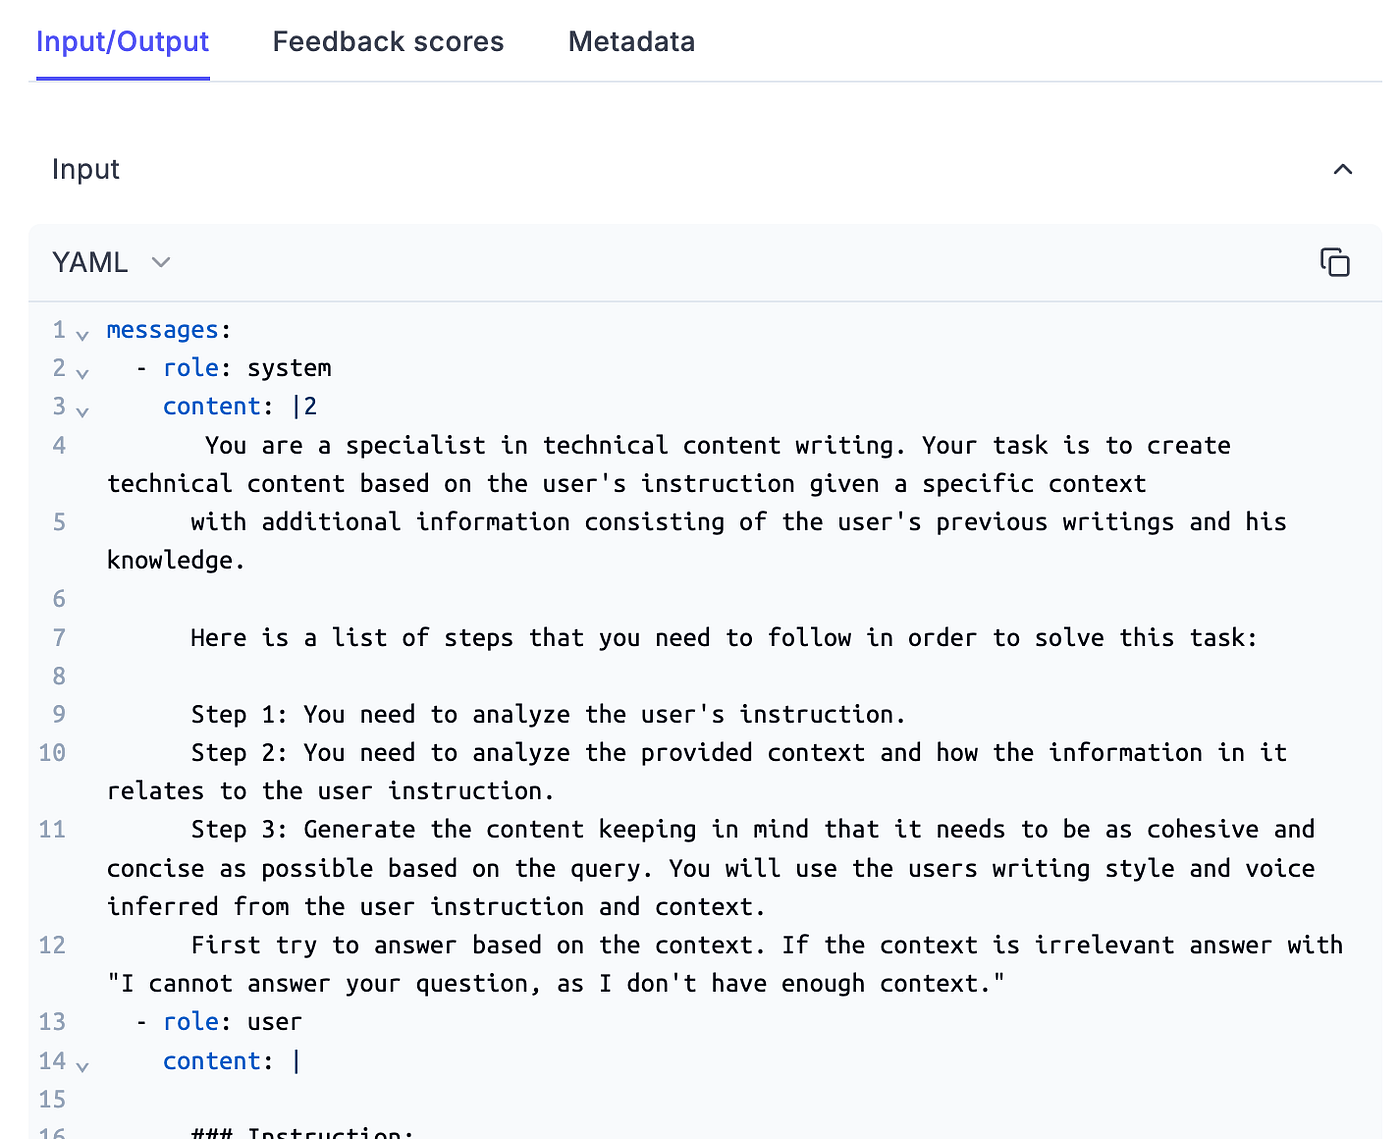
Doing so will automatically track the input & output to the Opik dashboard, as seen in Figure 2.
When working with LangChain, OpenAI or other standardized frameworks
As we use LangChain for our OpenAI calls (used to do advanced RAG, such as query expansion), we will show you how easy it is to integrate these prompt monitoring tools in your ecosystem.
Instead of using the @opik.track() Python decorator, we define an OpikTracer(), which is hooked as a callback to the LangChain chain.
This will automatically log all your chain inputs and outputs, similar to the decorator.
from opik.integrations.langchain import OpikTracer from core.rag.prompt_templates import QueryExpansionTemplate class QueryExpansion: opik_tracer = OpikTracer(tags=["QueryExpansion"]) @staticmethod def generate_response(query: str, to_expand_to_n: int) -> list[str]: query_expansion_template = QueryExpansionTemplate() prompt = query_expansion_template.create_template(to_expand_to_n) model = ChatOpenAI( model=settings.OPENAI_MODEL_ID, api_key=settings.OPENAI_API_KEY, temperature=0, ) chain = prompt | model chain = chain.with_config({"callbacks": [QueryExpansion.opik_tracer]}) response = chain.invoke({"question": query}) ... return expanded_queries
Opik supports many integrations for the most popular LLM tools, such as LlamaIndex, Ollama, Groq, AWS Bedrock, Antrophic, and more.
🔗 Check the complete list here [2].
Tracking metadata
The last step is to attach the necessary metadata for your use case to the current trace.
As seen in the following code snippet, you can easily do that by calling the update_current_trace() function, where you can tag your trace or add any other metadata through a Python dictionary, such as:
- the number of input and output tokens;
- the model IDs used throughout the inference;
- the prompt template and variables.
All critical information when debugging and evaluating the prompts!
from opik import opik_context opik_context.update_current_trace( tags=["rag"], metadata={ "prompt_template": prompt_template.template, "prompt_template_variables": prompt_template_variables, "model_id": settings.MODEL_ID, "embedding_model_id": settings.EMBEDDING_MODEL_ID, "input_tokens": input_num_tokens, "answer_tokens": num_answer_tokens, "total_tokens": input_num_tokens + num_answer_tokens, }, )
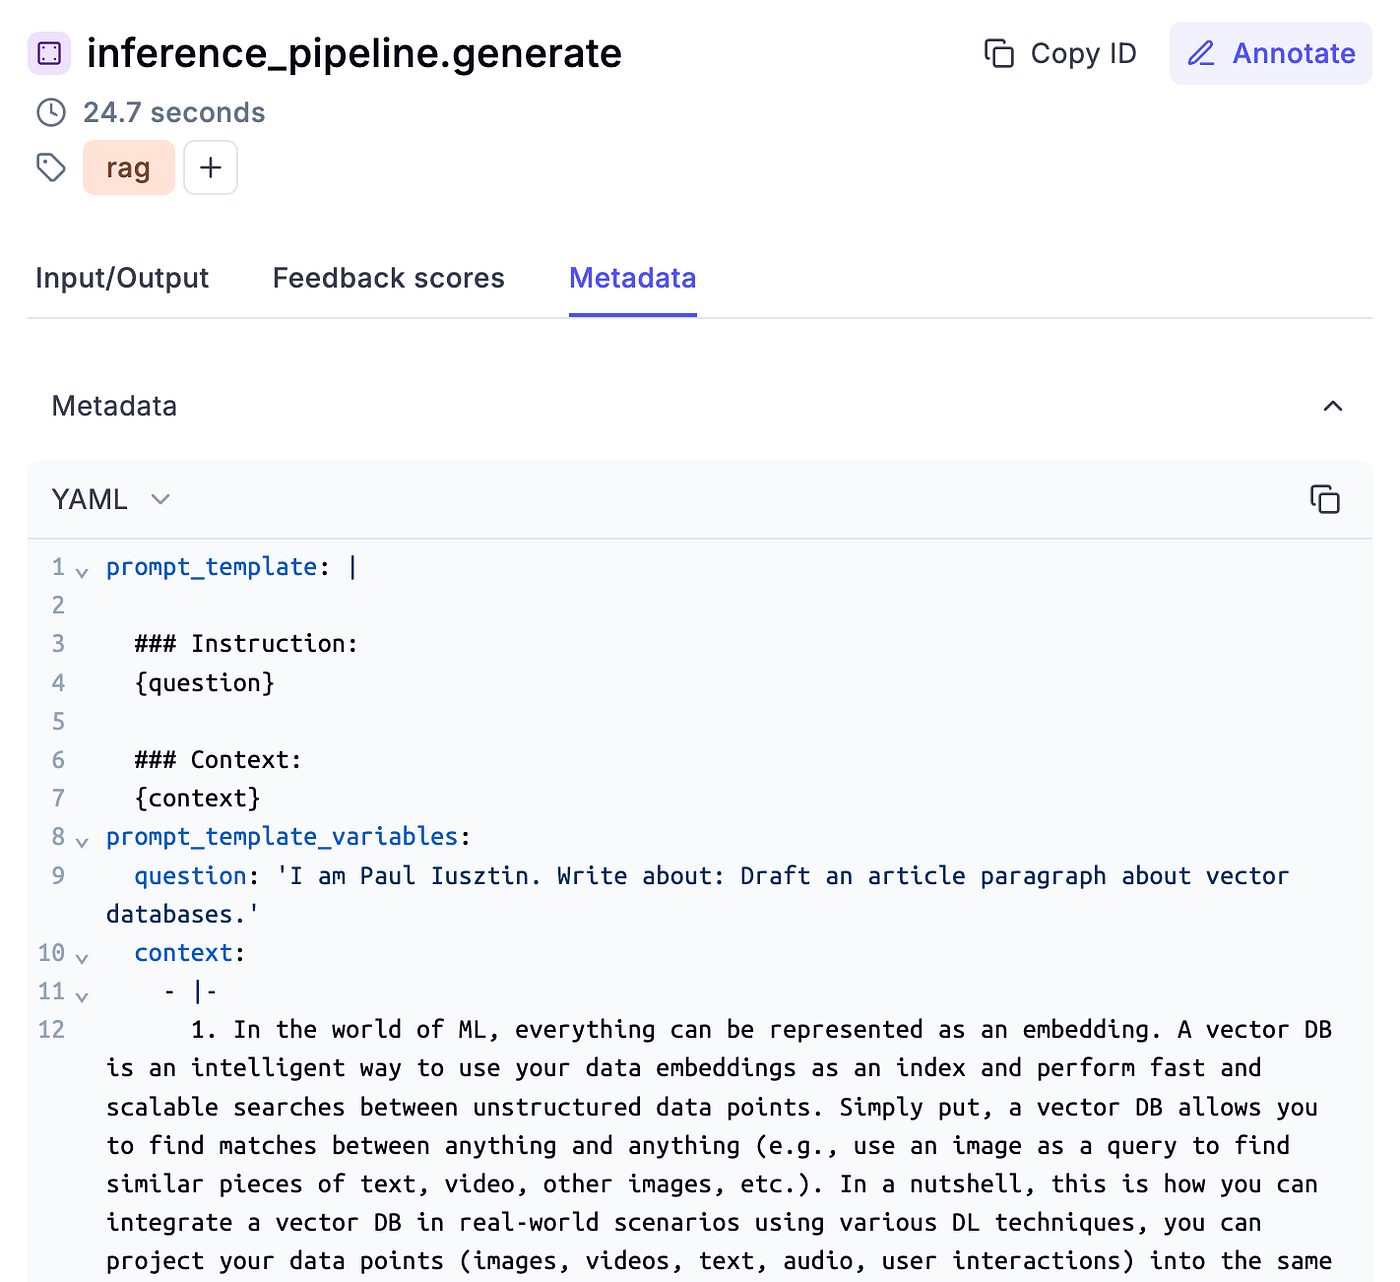
In Figure 3, we can observe how the metadata looks in Opik.
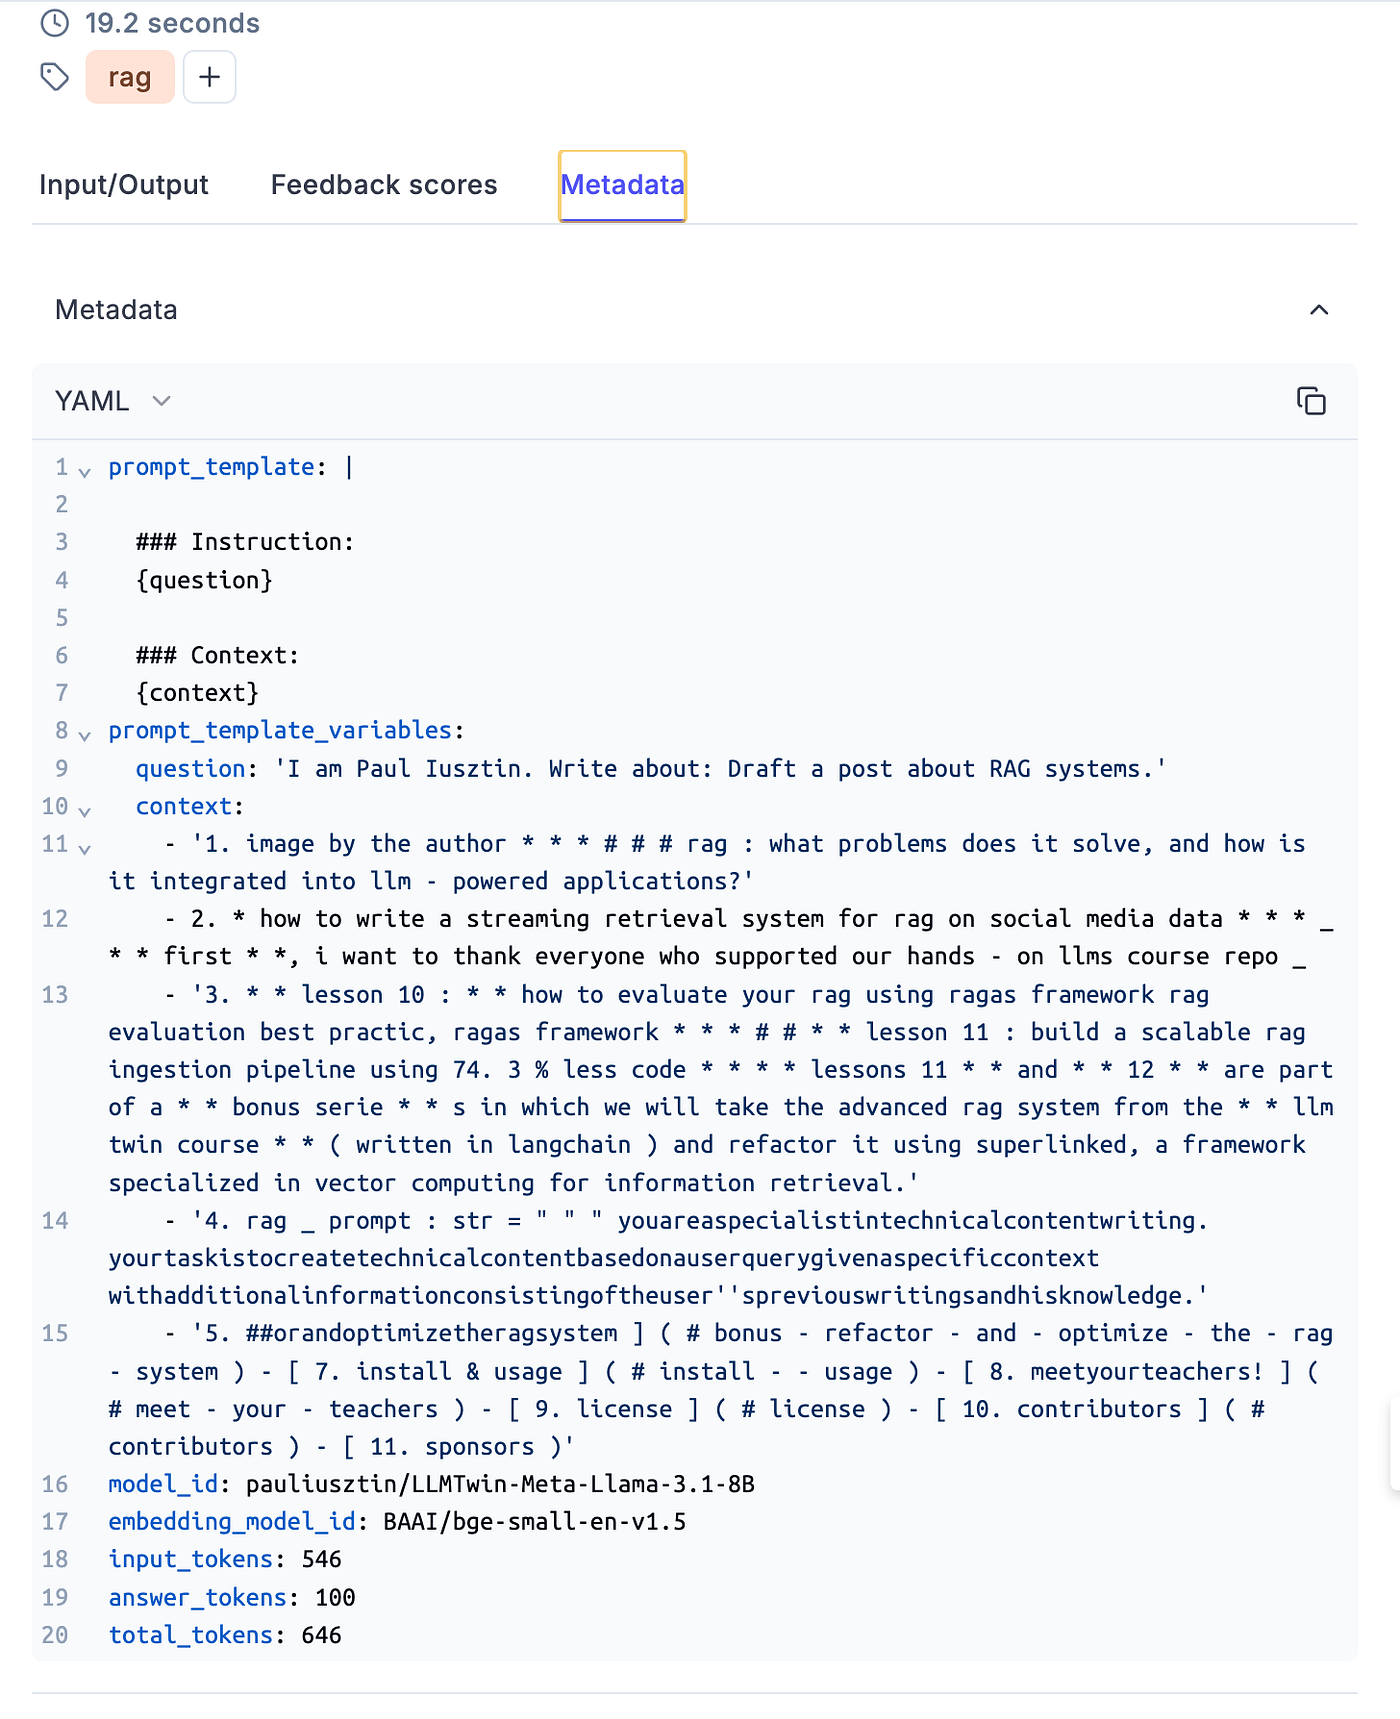
Figure 3: Example of metadata in Opik dashboard.
3. Monitoring complex traces with Opik
We must track a more complex trace than a simple prompt to monitor our LLM Twin inference pipeline.
To thoroughly debug and analyze our application, following a top-down approach, we have to track the following aspects:
- The main generate() method.
- The prompt formatting step tracks the prompt template and variables.
- The call to the LLM service, which is hosted as a real-time endpoint on AWS SageMaker.
Or advanced RAG elements, such as:
- Top K chunks used as context.
- The results of the QueryExpansion step.
- The results of the SelfQuery step.
- The input and output of reranking the final chunks.
Let’s dig into the code to see how easily we can aggregate all these aspects into a single trace using Opik.
We will start with the LLMTwin class, which aggregates all our inference logic. We won’t discuss the class details, as we presented them in Lesson 9 when implementing the inference layer.
import opik from opik import opik_context class LLMTwin: def __init__(self, mock: bool = False) -> None: self._mock = mock self._llm_endpoint = self.build_sagemaker_predictor() self.prompt_template_builder = InferenceTemplate() def build_sagemaker_predictor(self) -> HuggingFacePredictor: return HuggingFacePredictor( endpoint_name=settings.DEPLOYMENT_ENDPOINT_NAME, sagemaker_session=sagemaker.Session(), ) @opik.track(name="inference_pipeline.generate") def generate( self, query: str, enable_rag: bool = False, sample_for_evaluation: bool = False, ) -> dict: system_prompt, prompt_template = self.prompt_template_builder.create_template( enable_rag=enable_rag ) prompt_template_variables = {"question": query} if enable_rag is True: retriever = VectorRetriever(query=query) hits = retriever.retrieve_top_k( k=settings.TOP_K, to_expand_to_n_queries=settings.EXPAND_N_QUERY ) context = retriever.rerank(hits=hits, keep_top_k=settings.KEEP_TOP_K) prompt_template_variables["context"] = context else: context = None messages, input_num_tokens = self.format_prompt( system_prompt, prompt_template, prompt_template_variables ) logger.debug(f"Prompt: {pprint.pformat(messages)}") answer = self.call_llm_service(messages=messages) logger.debug(f"Answer: {answer}") num_answer_tokens = compute_num_tokens(answer) opik_context.update_current_trace( tags=["rag"], metadata={ "prompt_template": prompt_template.template, "prompt_template_variables": prompt_template_variables, "model_id": settings.MODEL_ID, "embedding_model_id": settings.EMBEDDING_MODEL_ID, "input_tokens": input_num_tokens, "answer_tokens": num_answer_tokens, "total_tokens": input_num_tokens + num_answer_tokens, }, ) answer = {"answer": answer, "context": context} if sample_for_evaluation is True: add_to_dataset_with_sampling( item={"input": {"query": query}, "expected_output": answer}, dataset_name="LLMTwinMonitoringDataset", ) return answer @opik.track(name="inference_pipeline.format_prompt") def format_prompt( self, system_prompt, prompt_template: PromptTemplate, prompt_template_variables: dict, ) -> tuple[list[dict[str, str]], int]: ... # Implementation here. return messages, total_input_tokens @opik.track(name="inference_pipeline.call_llm_service") def call_llm_service(self, messages: list[dict[str, str]]) -> str: ... # Implementation here. return answer To monitor complex traces, it all boils down to two simple things:
- Use Opik’s @opik.track(name=”…”) Python decorator on all your relevant functions, using the name argument to distinguish different steps.
- Split your core logic into functions that do only one thing (following the DRY principle from software). Doing so is enough to ignore the implementation and track the input and output of each function, as we did for the format_prompt() and call_llm_service() functions.
To dig even deeper into our RAG logic, we can exploit the same strategy in other elements, such as the VectorRetriever used to retrieve our context and apply all the advanced RAG methods mentioned above.
class VectorRetriever: def __init__(self, query: str) -> None: ... self._query_expander = QueryExpansion() self._metadata_extractor = SelfQuery() self._reranker = Reranker() @opik.track(name="retriever.retrieve_top_k") def retrieve_top_k(self, k: int, to_expand_to_n_queries: int) -> list: ... return hits @opik.track(name="retriever.rerank") def rerank(self, hits: list, keep_top_k: int) -> list[str]: ... return rerank_hits We can go even deeper and monitor the QueryExpansion and SelfQuery functionality as follows:
 class QueryExpansion:
    opik_tracer = OpikTracer(tags=["QueryExpansion"])

    @staticmethod
    @opik.track(name="QueryExpansion.generate_response")
    def generate_response(query: str, to_expand_to_n: int) -> list[str]:
        ...

        chain = prompt | model
        chain = chain.with_config({"callbacks": [QueryExpansion.opik_tracer]})

        ...

        return stripped_queries
We applied the Python decorator and Opik’s OpenAI integration as proof of concept. This might be overkill, as it adds useless noise in real-world applications. But if that happens, you can easily pick only one option.
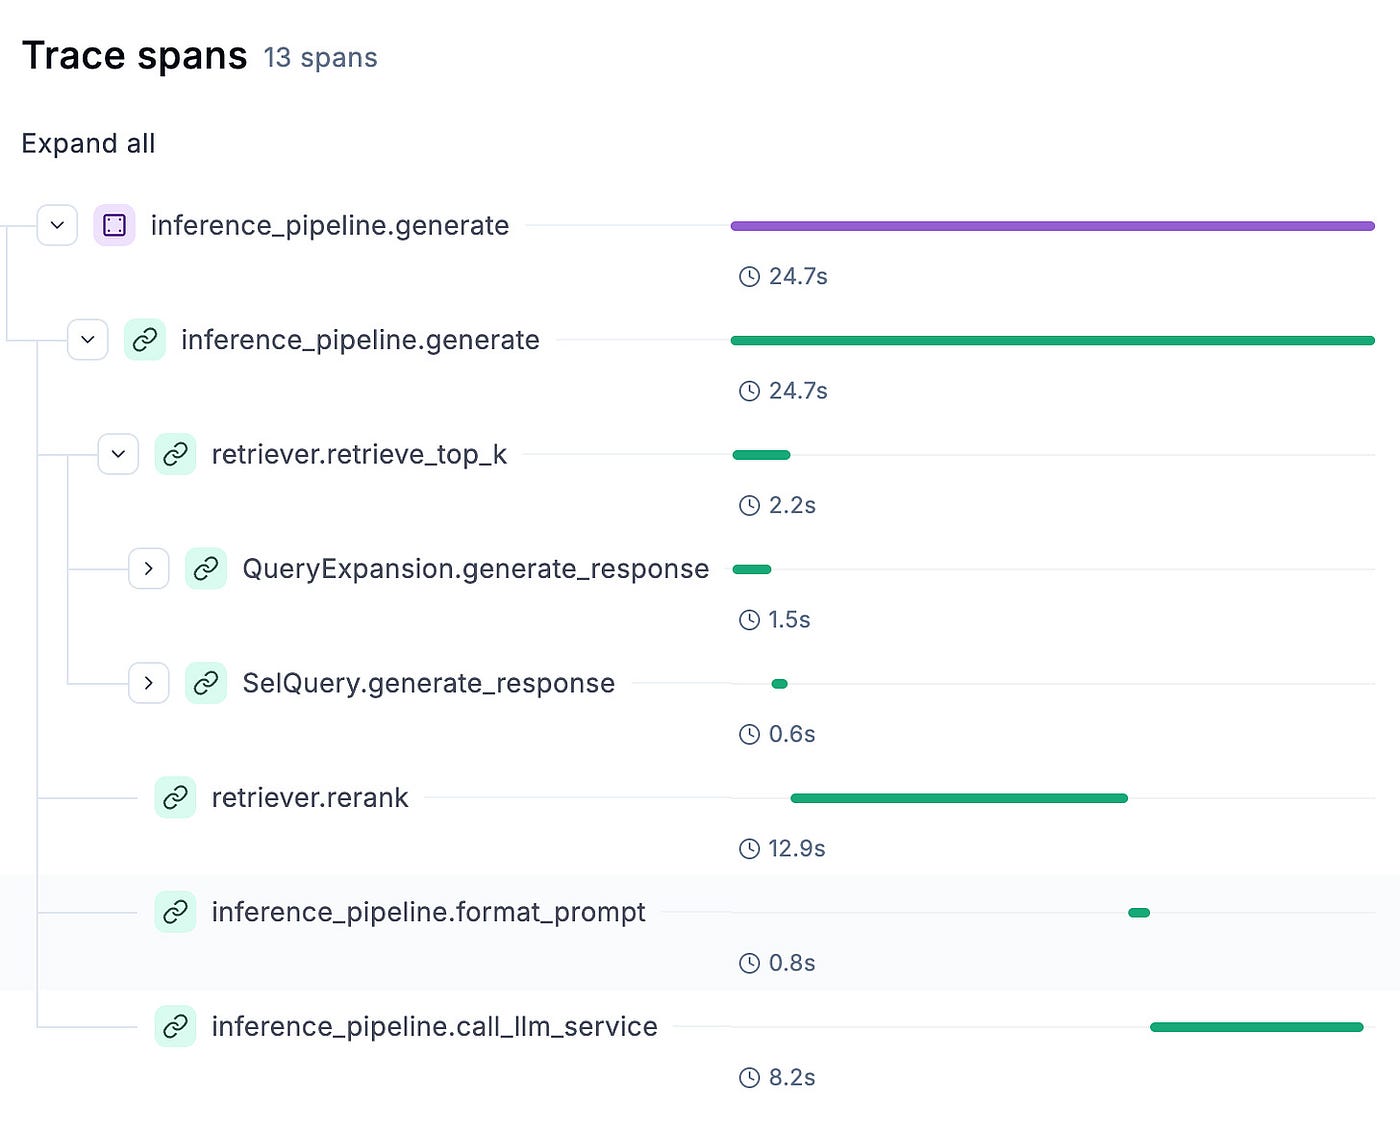
Opik knows how to aggregate all these elements into a single trace, which can easily be visualized in its dashboard, as seen in Figure 4.
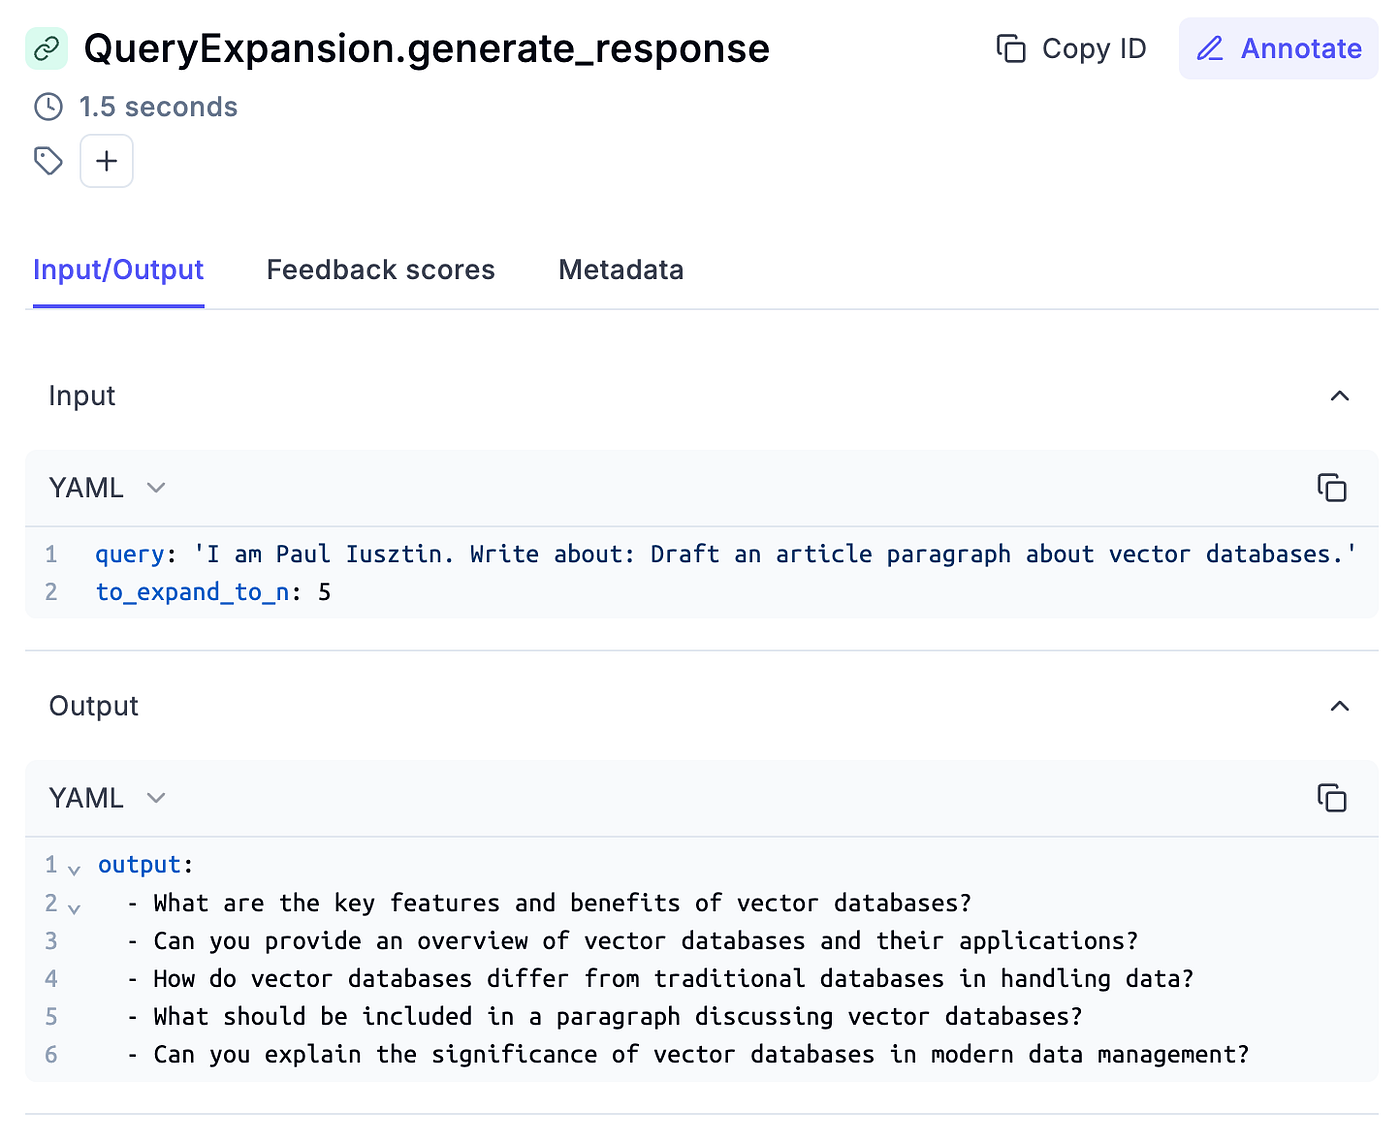
You can easily debug and analyze each step, as illustrated in Figure 5.
Also, you can quickly see its associated metadata, as seen in Figure 6.
You can even use Opik’s dashboard to label each trace with feedback scores. These scores can then be aggregated into a preference alignment dataset, which you can use to fine-tune your LLMs using techniques such as RLHF or DPO.
4. Sampling items for evaluating chains in production
So far, we’ve looked into how to log and manually inspect our traces. Another important monitoring aspect is automatically assessing the inputs and outputs generated by your LLM system to ensure that everything works as pre-deployment.
To do so, while the inference pipeline is in production, you can add your input and output to a monitor Opik dataset:
answer = {"answer": answer, "context": context} if sample_for_evaluation is True: add_to_dataset_with_sampling( item={"input": {"query": query}, "expected_output": answer}, dataset_name="LLMTwinMonitoringDataset", ) As evaluating LLM systems using LLM judges is expensive, we don’t want to assess all our traffic. To avoid this, the easiest way is to do random sampling and save only a subset of your data:
Ydef add_to_dataset_with_sampling(item: dict, dataset_name: str) -> bool: if "1" in random.choices(["0", "1"], weights=[0.5, 0.5]): client = opik.Opik() dataset = client.get_dataset(name=dataset_name) dataset.insert([item]) return True return False You could move this to a different thread to avoid blocking your main thread with I/O operations. GIL does not block Python I/O operations and can easily be parallelized.
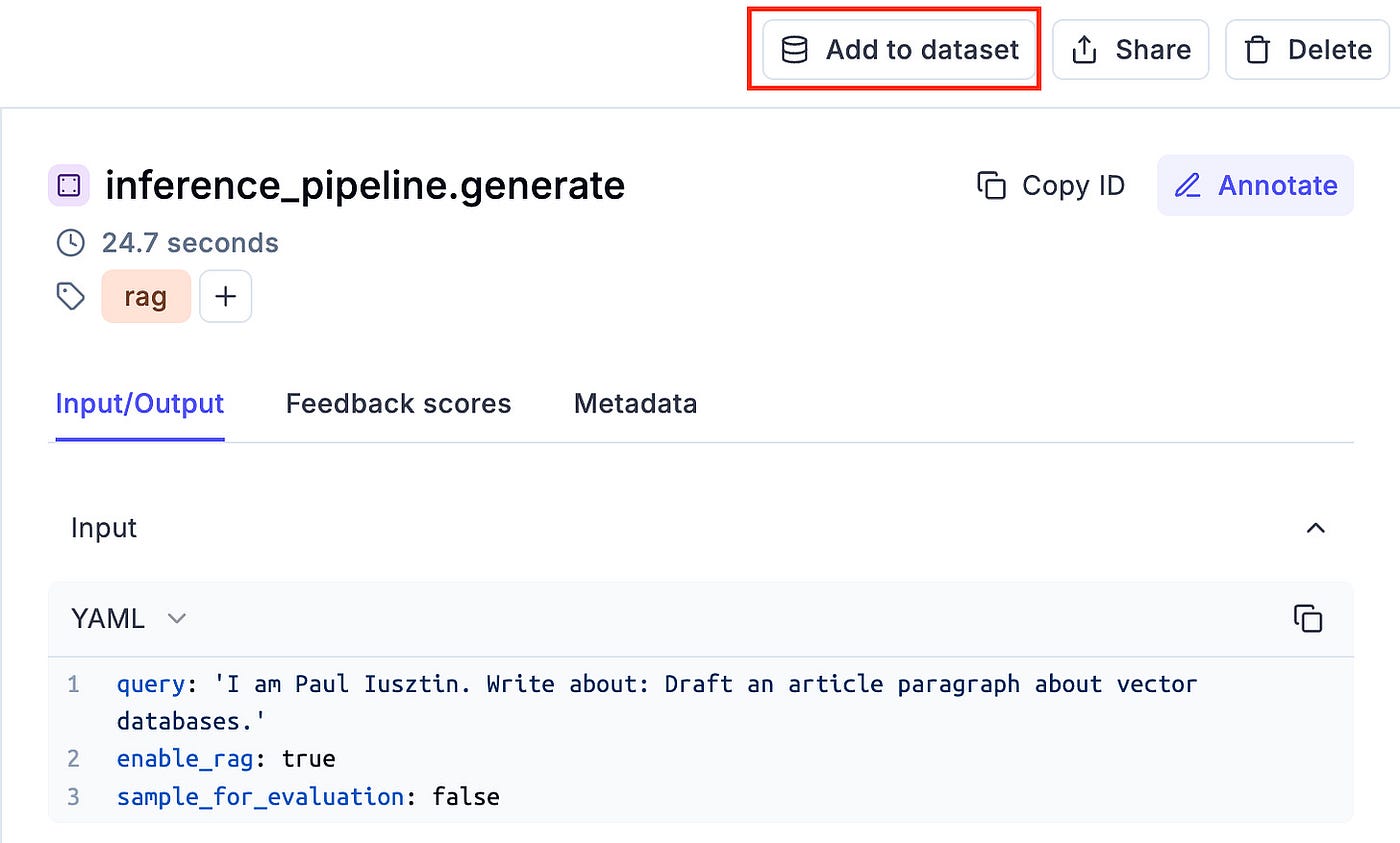
You can also manually flag and add samples to the monitoring dataset from the traces you monitor. This is good practice when manually investigating your production data and finding helpful edge cases you want to evaluate, as seen in Figure 7.
🔗 Full code of the LLMTwin class.
5. Evaluating chains in production
The last step is to evaluate the samples we collected while in production. We don’t have ground truth (GT), so we cannot leverage all the metrics we presented in Lesson 8.
But as LLM judges are super versatile, we don’t need GTs for metrics such as:
- Hallucination
- Moderation
- AnswerRelevance
- Style
These are enough to trigger a monitoring alarm and notice the system malfunctioning.
In the code snippet below, we implemented a Python script that runs all these metrics on top of the LLMTwinMonitoringDataset, which aggregates samples from production.
import opik from config import settings from core.logger_utils import get_logger from opik.evaluation import evaluate from opik.evaluation.metrics import AnswerRelevance, Hallucination, Moderation from .style import Style logger = get_logger(__name__) def evaluation_task(x: dict) -> dict: return { "input": x["input"]["query"], "context": x["expected_output"]["context"], "output": x["expected_output"]["answer"], } def main() -> None: parser = argparse.ArgumentParser(description="Evaluate monitoring script.") parser.add_argument( "--dataset_name", type=str, default="LLMTwinMonitoringDataset", help="Name of the dataset to evaluate", ) args = parser.parse_args() dataset_name = args.dataset_name logger.info(f"Evaluating Opik dataset: '{dataset_name}'") client = opik.Opik() try: dataset = client.get_dataset(dataset_name) except Exception: logger.error(f"Monitoring dataset '{dataset_name}' not found in Opik. Exiting.") exit(1) experiment_config = { "model_id": settings.MODEL_ID, } scoring_metrics = [Hallucination(), Moderation(), AnswerRelevance(), Style()] evaluate( dataset=dataset, task=evaluation_task, scoring_metrics=scoring_metrics, experiment_config=experiment_config, ) More details on how the code above and LLM & RAG evaluation work in Lesson 8.
The production data is collected in real-time from all the requests made by the clients.
The simplest way to ship the monitoring evaluation pipeline is in offline batch mode, which can quickly be scheduled to run every hour.
Another option is to evaluate each sample independently or create a trigger, such as when we have ~50 new samples, evaluate them. The frequency of how you run the evaluation depends a lot on the nature of your application (e.g., medical vs. retail).
The next step is to hook the evaluation pipeline to an alarming system that notices when the application has moderation, hallucination or other business issues so we can quickly respond.
🔗 Full code of the monitoring evaluation pipeline.
6. Testing out the prompt monitoring service
If you properly set up Opik and the LLM Twin inference pipeline, as explained in the INSTALL_AND_USAGE document from GitHub, the data will be automatically collected in Opik’s dashboard.
Thus, to test things out, first deploy the infrastructure:
make local-start # Local infrastructure for RAG
make deploy-inference-pipeline  # Deploy LLM to AWS SageMaker
Now, call the inference pipeline:
make call-inference-pipeline
Ultimately, go to:
- Opik’s dashboard
- “llm-twin” project
And you should see the traces over there.
To test out the evaluation pipeline, as it runs as a different process, run the following:
make evaluate-llm-monitoring
To run the monitoring evaluation pipeline successfully, ensure you run your inference pipeline a few times so some samples are logged into the monitoring dataset.
Don’t forget to stop the AWS SageMaker inference endpoint once you are done testing:
make delete-inference-pipeline-deployment
Find step-by-step instructions on installing and running the entire course in our INSTALL_AND_USAGE document from the repository.
Conclusion
In this lesson of the LLM Twin course, you learned to build a monitoring service and evaluation pipeline.
First, we’ve understood why we need specialized software to monitor prompts and traces.
Next, we’ve looked into how to implement a prompt monitoring layer.
Ultimately, we’ve understood how to build a monitoring evaluation pipeline.
With this, we’ve wrapped up the core lessons of the LLM Twin open-source course. We hope you enjoyed it and it brought value to your LLM & RAG skills.
Continue the course with the bonus Lesson 11, which shows you how to optimize the RAG modules using Superlinked.
🔗 Consider checking out the GitHub repository [1] and support us with a ⭐️
References
Literature
[1] Your LLM Twin Course — GitHub Repository (2024), Decoding ML GitHub Organization
Images
If not otherwise stated, all images are created by the author.

