How to Integrate D3.js Graphs in a Comet Panel
Comet is an experimentation platform for monitoring and tracking your Machine Learning experiments. You can also use Comet to build your reports, that show your experiments to your teammates or your clients. While building a report, you can use the built-in panels, or build your own, using the very powerful SDK provided by the online dashboard.
In this article, I describe an overview of the Comet SDK, as well as a practical example, which shows you how to build a Comet Panel using the D3.js Javascript library.
The article is organized as follows:
- Overview of the Comet SDK
- The
Comet.Panelclass - The
APIclass - A practical example of using D3.js
Overview of the Comet SDK
Comet provides an online SDK to build custom panels. You can write your custom panels either in Python or in Javascript:
- The Python SDK supports the most popular libraries, including matplotlib and Pandas.
- The Javascript SDK permits you to include any library that is available on the Web.
To access the Comet SDK, you can click on the +Add button, located in the top right part of your experiment dashboard, and then select New Panel, as shown in the following figure:

A popup window opens. You can select the +Create New button to access the Comet SDK, which is shown in the following figure:

In the top right part of the screen, you can select your preferred language, either Python or Javascript. In this article, I focus on Javascript, but a similar approach can be followed in Python.
If you select Javascript as the main language, you can see that the code on the left changes. The editor provides different tabs, which you can use to configure your panel, as shown in the following figure:

Under the HTML tab, you can configure your HTML code, including the containers which will contain your graphs. Under the Resources tab, you can add your preferred Javascript libraries, simply by adding their URLs, as shown in the following figure:
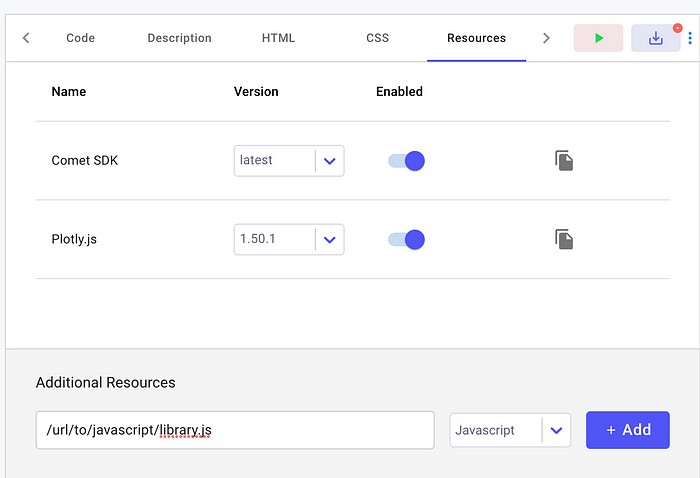
The Comet SDK already provides the Plotly.js library. However, you can disable it, simply by clicking on the corresponding button.
The Comet.Panel class
To build a custom Panel in Javascript, you need to create a class, which extends the Comet.Panel class, as follows:
class MyPanel extends Comet.Panel {
   async draw(experimentKeys, projectId);
}
This class must implement at least the draw() method, which draws the Panel. This method receives as input the list of experiment keys and the project id. If you want to deal with a specific experiment, you can use the drawOne() method, which receives as input a single experiment.
The Panel can also receive as input some parametric options, which can be changed dynamically without changing the code. In this case, you need to also define an additional method, named setup(), which contains the default values for the options:
setup(){
  this.options.myparameter = <MY_DEFAULT_VALUE>;}
All the options you define will be available under the Options tab when you will add the Panel to your project.
For more details on the methods provided by the Comet.Panel you can read the Comet official documentation.
Once you create the Panel, you can add it to your project, by clicking +Add→New Panel →Workspace →<YOUR_PANEL>.
The API class
Within a Panel, you can access all the objects logged in Comet through the API class. The Comet.Panel provides an API object, which you can use to access all the Comet experiments.
For example, you can access the experiment name, given its key, as follows:
const name = this.api.experimentName(experimentKey)
and you can get a specific asset through the this.api.experimentAssetByName() method.
For more details on the methods provided by the API class, you can refer to the Comet official documentation.
A practical example using D3.js
We can now implement a practical example, which draws the following graph within a Comet Panel:
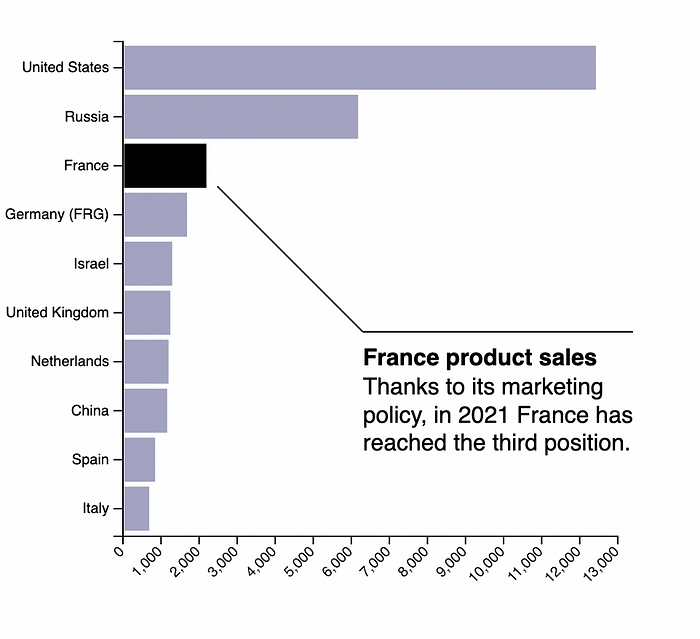
The example uses a dataset provided by the Stockholm International Peace Research Institute, containing the number of weapons exported by the top 50 largest exporters in 2017. You can download the dataset from this link.
The idea is to build a Comet experiment, which logs the dataset as an asset, retrieves it from the Comet Panel, and uses it to build the graph.
The example is organized into two parts:
- Log the dataset in Comet
- Build the Panel using the Comet SDK and D3.js
Comet is free for students and start-ups — try Panels today to visualize your work and collaborate across your team.
Log the dataset in Comet
Firstly, I load the dataset as a Pandas dataframe:
import pandas as pddf = pd.read_csv('https://raw.githubusercontent.com/holtzy/data_to_viz/master/Example_dataset/7_OneCatOneNum_header.csv')
Here is a snapshot of the dataset:
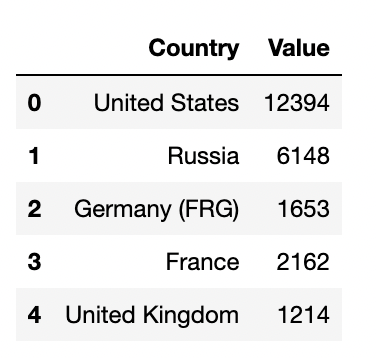
Then, I build a Comet experiment:
from comet_ml import Experimentexperiment = Experiment(project_name="d3-example")
and I log the dataframe in Comet:
experiment.log_table('data.csv', tabular_data=df)
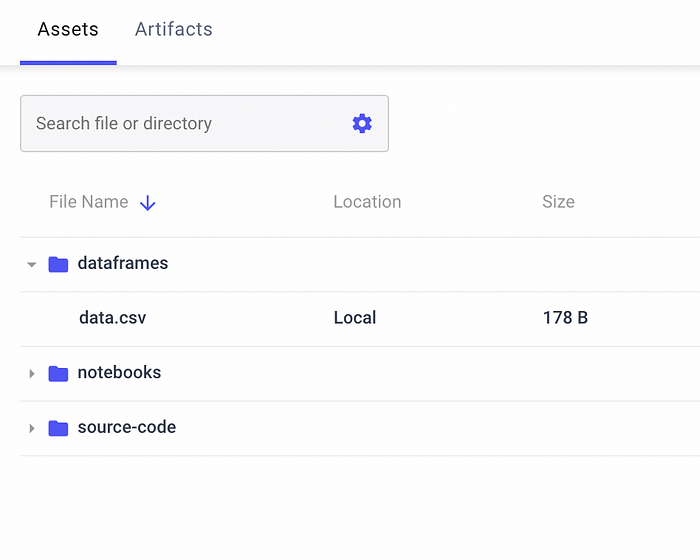
I run the experiment. Once it is completed, I can see the data.csv file under the Assets & Artifacts section of the Comet experiment, as shown in the following figure:
Build the Panel using the Comet SDK and D3.js
I access the Comet SDK and I select Javascript as the programming language. I configure the Resources sections with these two URLs:
The second URL permits you to add annotations to a D3 graph.
Now I configure the HTML tab, with the following container:
<div id="bar"></div>
I’m ready to write my Panel:
class MyPanel extends Comet.Panel {
  setup() {}
  async drawGraph(data_string){}
  async draw(experimentKeys, projectId) {}
}
The class defines 3 methods:
setup()— to configure optionsdrawGraph()— an async method that will draw the D3 graphdraw()— the default Comet.Panel method to build a graph
The setup method defines the options:
setup() {
    this.options = {
      width : 460,
      height : 400,
    };
  }
I consider the graph width and height as default options.
The draw() method retrieves for each experiment the associated asset through the experimentAssetByName(). Note the use of the await keyword to wait until data is ready. Then it calls the drawGraph() method to draw the D3 graph. The experimentAssetByName() method returns the asset as a string, so I need to convert it to an object processable by D3 within the drawGraph()method.
async draw(experimentKeys, projectId) {
    experimentKeys.forEach(async experimentKey => {
       const data = await this.api.experimentAssetByName(experimentKey,
                   'data.csv');

         this.drawGraph(data);

   });
  }
Within the drawGraph() method, firstly, I define margins:
var margin = {top: 20, right: 30, bottom: 40, left: 90},
    width = this.options.width - margin.left - margin.right,
    height = this.options.height - margin.top - margin.bottom;
Then, I retrieve the div from the HTML and I append to it an SVG object:
var svg = d3.select("#bar")
  .append("svg")
    .attr("width", width + margin.left + margin.right)
    .attr("height", height + margin.top + margin.bottom)
  .append("g")
    .attr("transform",
          "translate(" + margin.left + "," + margin.top + ")");
Now, I convert the data passed as a string to object, by calling the d3.Parse()function. I also apply a preprocessing function, which organizes data:
var data = await d3.csvParse(data_string, function(d) {

  return {Country: d.Country, Value: +d.Value};
});
I order the data:
data.sort(function(x, y){return d3.descending(x.Value, y.Value);})
I add the two axes:
var x = d3.scaleLinear()
    .domain([0, 13000])
    .range([ 0, width]);
  svg.append("g")
    .attr("transform", "translate(0," + height + ")")
    .call(d3.axisBottom(x))
    .selectAll("text")
      .attr("transform", "translate(-10,0)rotate(-45)")
      .style("text-anchor", "end");// Y axis
  var y = d3.scaleBand()
    .range([ 0, height ])
    .domain(data.map(function(d) { return d.Country; }))
    .padding(.1);
  svg.append("g")
    .call(d3.axisLeft(y))
and the bars:
svg.selectAll("myRect")
    .data(data)
    .enter()
    .append("rect")
    .attr("x", x(50) )
    .attr("y", function(d) { return y(d.Country); })
    .attr("width", function(d) { return x(d.Value); })
    .attr("height", y.bandwidth() )
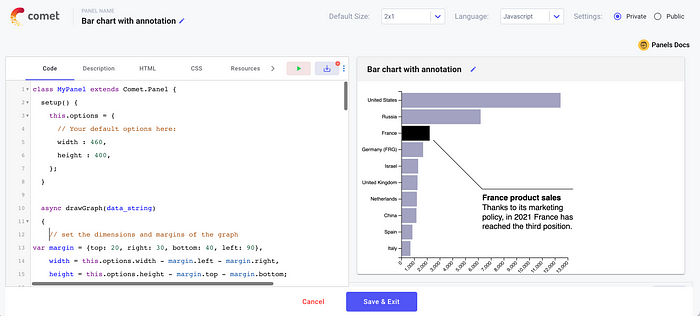
    .attr("fill", function(d){ if (d.Country == 'France') return "#000000" ; else return "#a3a3c2"})
Finally, I add the annotations:
const annotations = [
    {
    note: {
      label: "Thanks to its marketing policy, in 2021 France has reached the third position.",
      title: "France product sales",
      wrap: 200,  // try something smaller to see text split in several lines
      padding: 10   // More = text lower

    },
    color: ["#000000"],
    x: x(2500),
    y: 100,
    dy: 100,
    dx: 100
  }
]// Add annotation to the chart
const makeAnnotations = d3.annotation()
  .annotations(annotations)svg.append("g")
  .call(makeAnnotations)
The following graph shows the result in the Comet SDK:
Now, you can save the Panel and add it to your project.
Summary
Congratulations! You have just learned how to integrate D3.js charts in the Comet SDK! After an initial configuration, you can write your Javascript code as you usually do in Javascript!
You can access the live example used in this article directly in Comet at this link.
Comet is a very powerful platform, which can be used for different purposes. For example, you can compare two or more experiments in Comet or use the Comet Registry to track your Machine Learning models.
Happy coding! Happy Comet!


