Explainable AI: Visualizing Attention in Transformers

In this article we explore one of the most popular tools for visualizing the core distinguishing feature of transformer architectures: the attention mechanism. Keep reading to learn more about BertViz and how you can incorporate this attention visualization tool into your NLP and MLOps workflow with Comet.
Feel free to follow along with the full-code tutorial here, or, if you can’t wait, check out the final project here.
Introduction
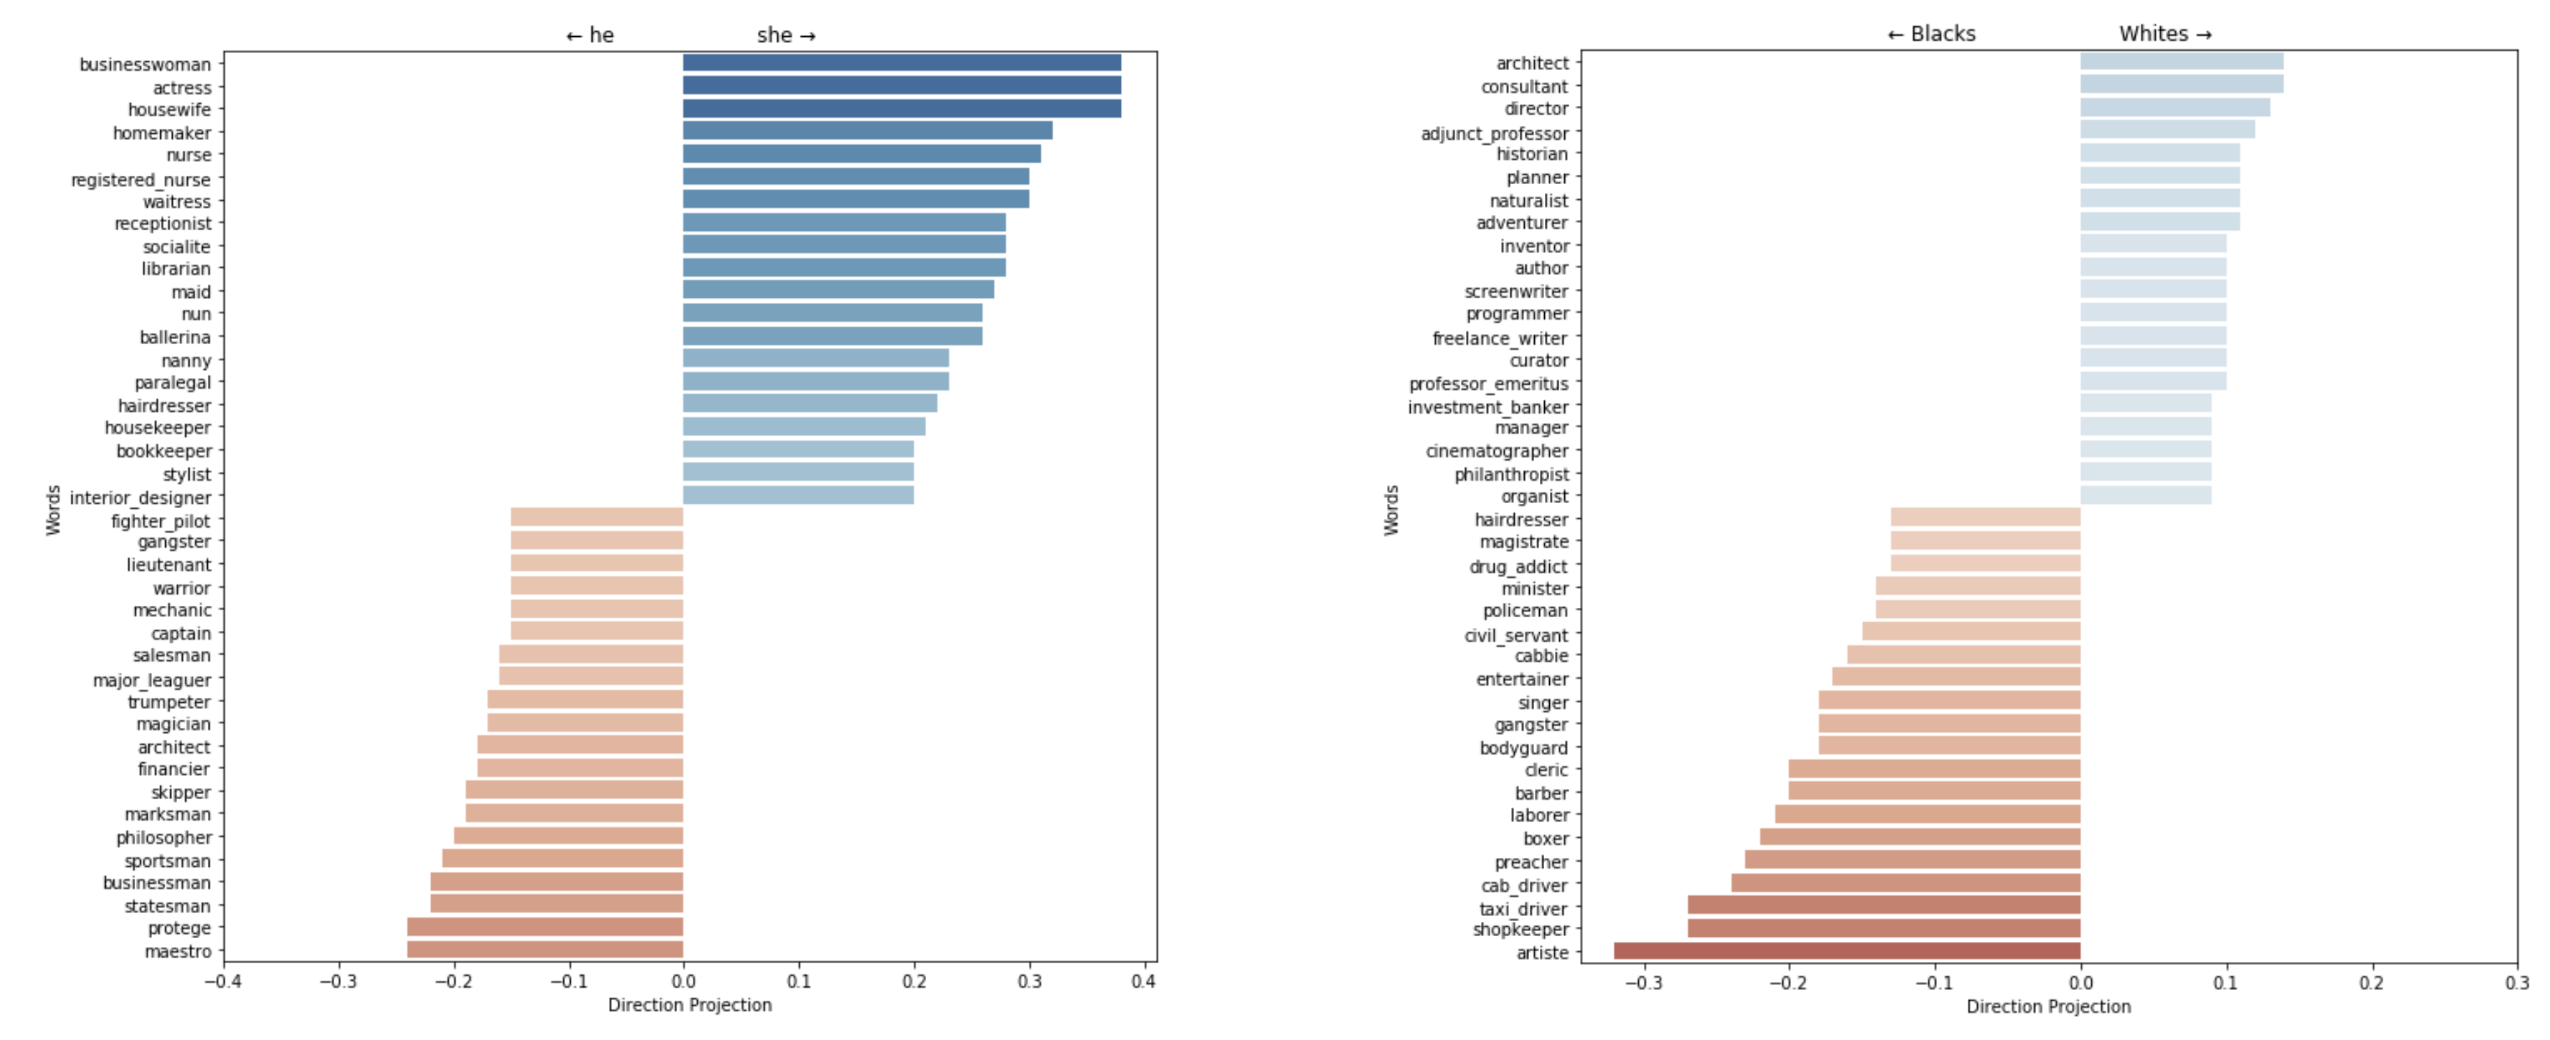
Transformers have been described as the single most important technological development to NLP in recent years, but their processes remain largely opaque. This is a problem because, as we continue to make major machine learning advancements, we can’t always explain how or why– which can lead to issues like undetected model bias, model collapse, and other ethical and reproducibility issues. Especially as models are more frequently deployed to sensitive areas like healthcare, law, finance, and security, model explainability is critical.
What is BertViz?
BertViz is an open source tool that visualizes the attention mechanism of transformer models at multiple scales, including model-level, attention head-level, and neuron-level. But BertViz isn’t new. In fact, early versions of BertViz have been around since as early as 2017.
So, why are we still talking about BertViz?
BertViz is an explainability tool in a field (NLP) that is otherwise notoriously opaque. And, despite its name, BertViz doesn’t only work on BERT. The BertViz API supports many transformer language models, including GPT2, T5, and most HuggingFace models.

As transformer architectures have increasingly dominated the machine learning landscape in recent years, they’ve also revived an old but important debate regarding interpretability and transparency in AI. So, while BertViz may not be new, its application as an explainability tool in the AI space is more relevant now than ever.
But first, transformers
To explain BertViz, it helps to have a basic understanding of transformers and self-attention. If you’re already familiar with these concepts, feel free to skip ahead to the section where we start coding.
We won’t go into the nitty gritty details of transformers here, as that’s a little beyond the scope of this article, but we will cover some of the basics. I also encourage you to check out the additional resources at the end of the article.
In the beginning (the prehistoric era of NLP)
So, how, exactly, does a computer “learn” natural language? In short, they can’t– at least not directly. Computers can only understand and process numerical data, so the first step of NLP is to break down sentences into “tokens,” which are assigned numerical values. The question driving NLP then becomes “how can we accurately reduce language and communication processes to computations?”
Some of the first NLP models included feed-forward neural networks like the Multi-Layer Perceptron (MLP) and even CNNs, which are more popularly used today for computer vision. These models worked for some simple classification tasks (like sentiment analysis) but had a major drawback: their feed-forward nature meant that at each point in time, the network only saw one word as its input. Imagine trying to predict the word that follows “the” in a sentence. How many possibilities are there?

To solve this problem, Recurrent Neural Networks (RNNs) and Long Short-Term Memory Networks (LSTMs like Seq2Seq) allowed for feedback, or cycles. This meant that each computation was informed by the previous computation, allowing for more context.
This context was still limited, however. If the input sequence was very long, the model would tend to forget the beginning of the sequence by the time it got to the end of the sequence. Also, their sequential nature didn’t allow for parallelization, making them extremely inefficient. RNNs also suffered notoriously from exploding gradients.
Introducing transformers
Transformers are sequence models that abandon the sequential structure of RNNs and LSTMs and adopt a fully attention-based approach. Transformers were initially developed for text processing, and are central to relatively all state-of-the-art NLP neural networks today, but they can also be used with image, video, audio, or virtually any other sequential data.
The key differentiating feature of transformers from previous NLP models was the attention mechanism, as popularized in the Attention Is All You Need paper. This allowed for parallelization, which meant faster training and optimized performance. Attention also allowed for much larger contexts than recurrence, meaning transformers could craft more coherent, relevant, and complex outputs.
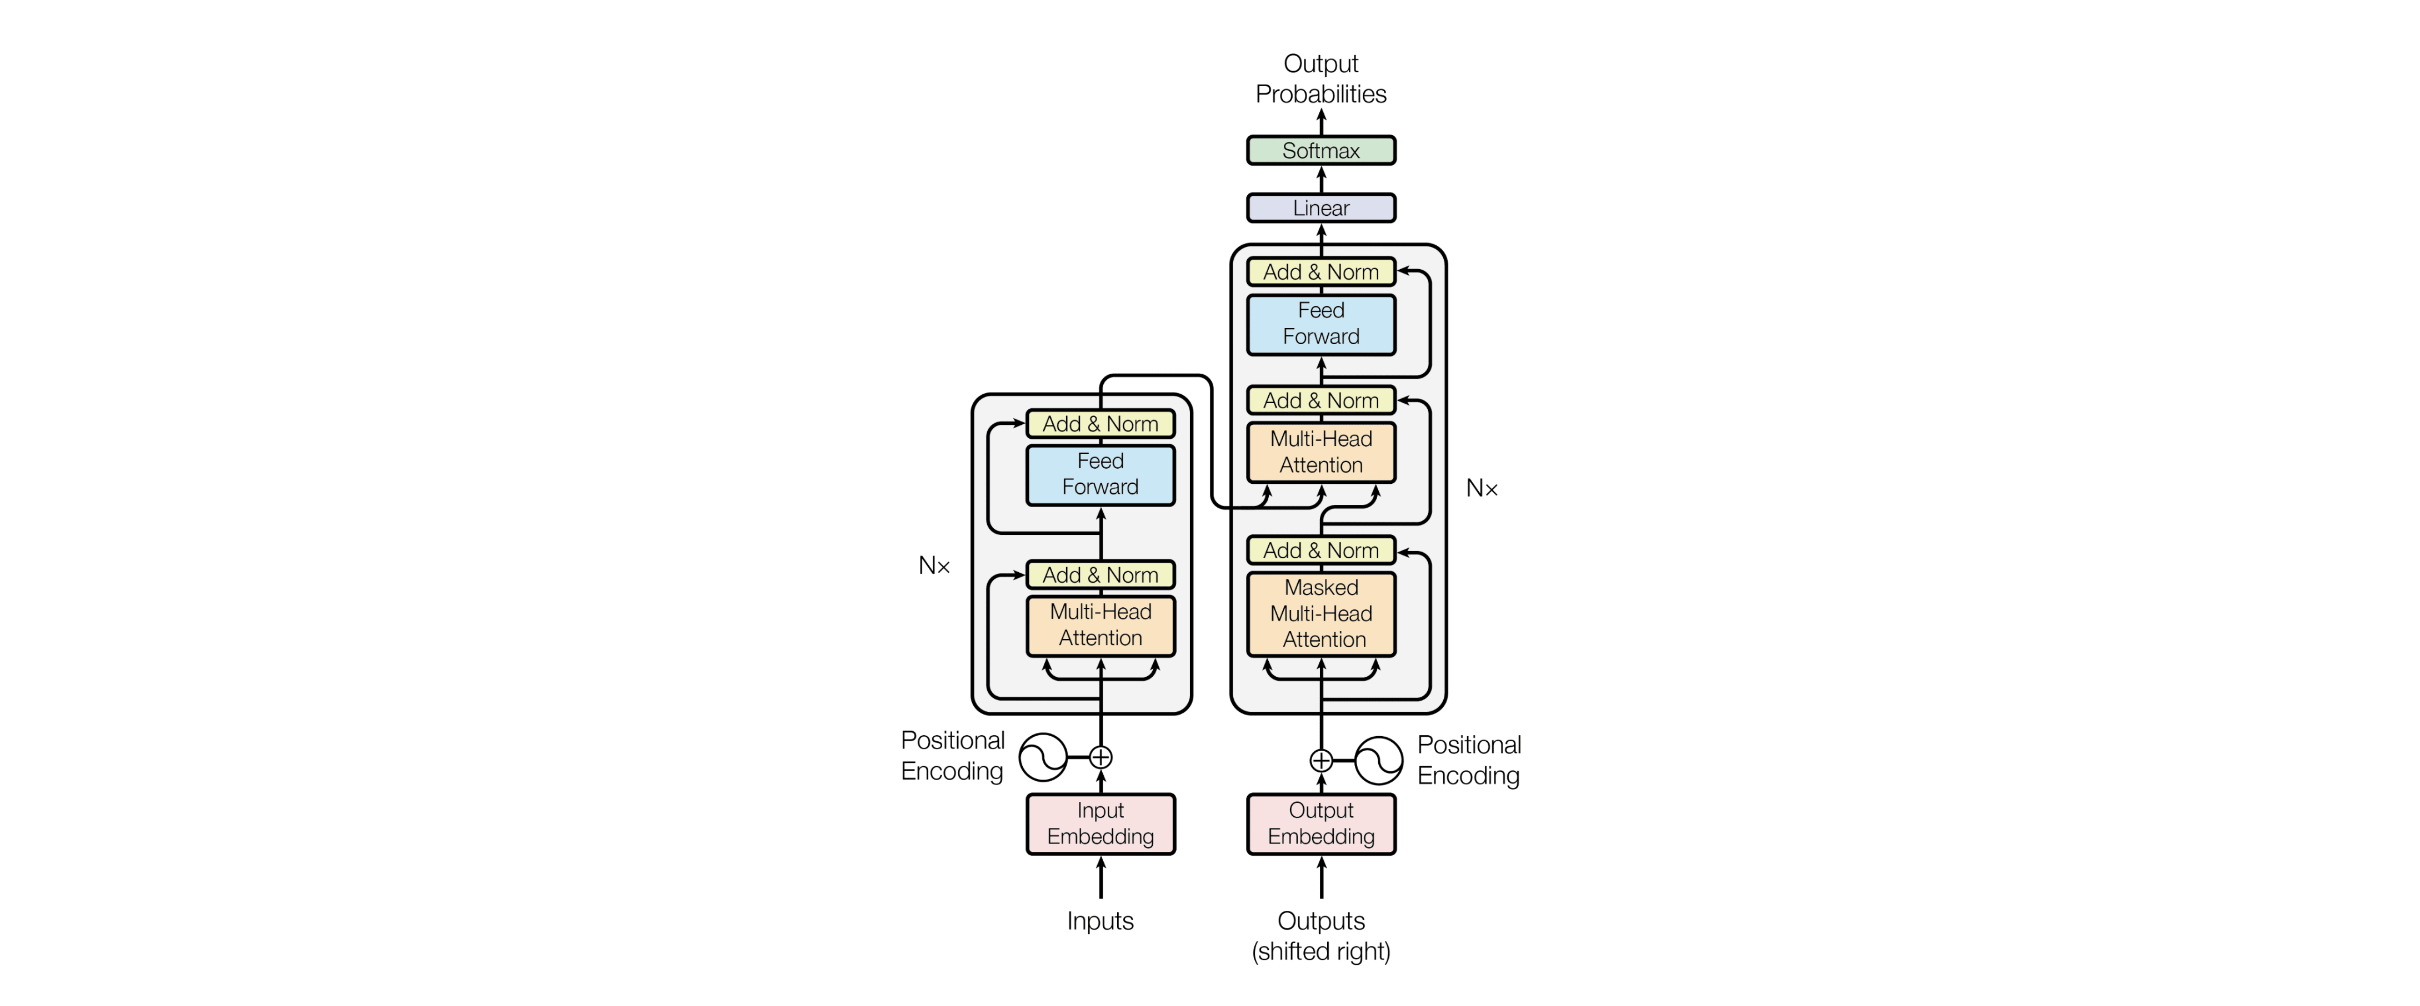
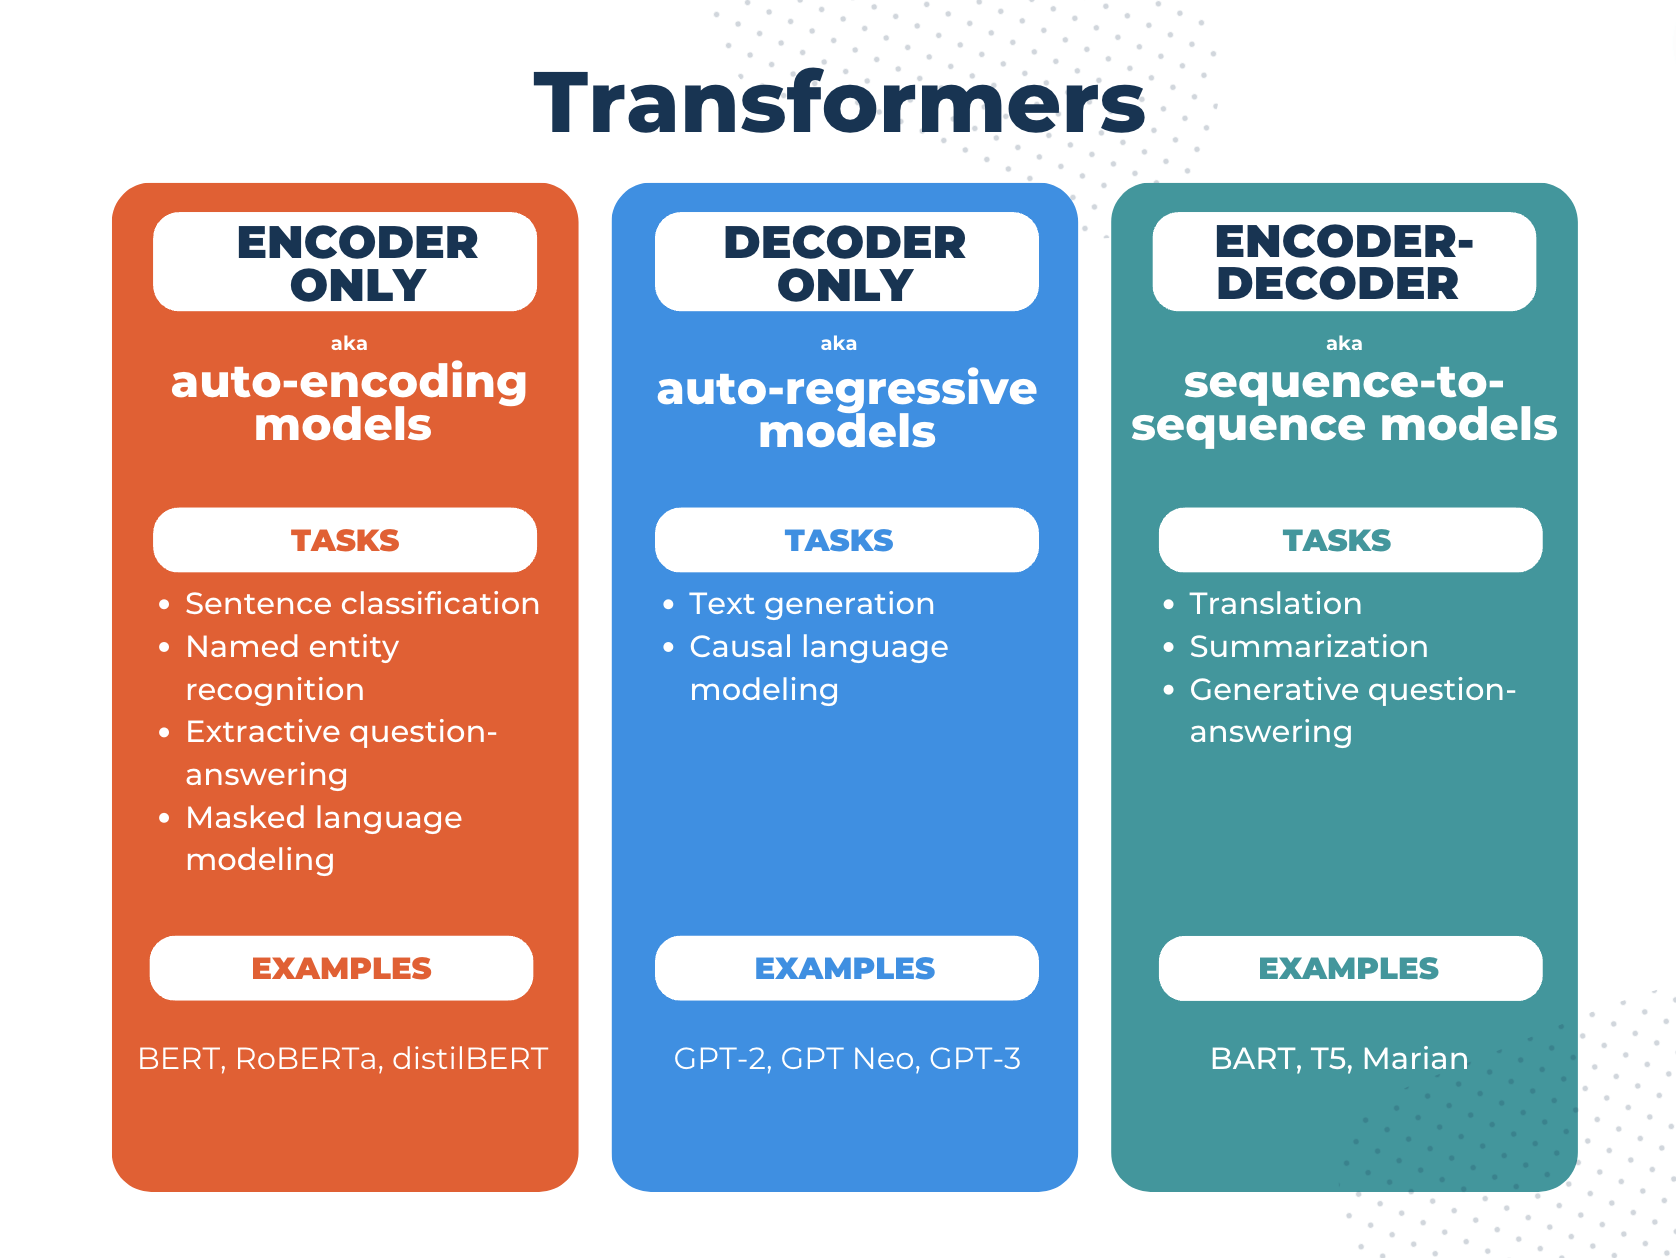
Transformers are made up of encoders and decoders, and the tasks we can perform with them depend on whether we use either or both of these components. Some common transformer tasks for NLP include text classification, named entity recognition, question-answering, text summarization, fill-in-the-blanks, next word prediction, translation, and text generation.
How do transformers fit into the larger ecosystem of NLP models?
You’ve probably heard of Large Language Models (LLMs) like ChatGPT or LLaMA. The transformer architecture is a fundamental building block of LLMs, which use self-supervised learning on vast amounts of unlabelled data. These models are also sometimes referred to as “foundation models” because they tend to generalize well to a wide range of tasks, and in some cases are also available for more specific fine-tuning. BERT is an example of this category of model.
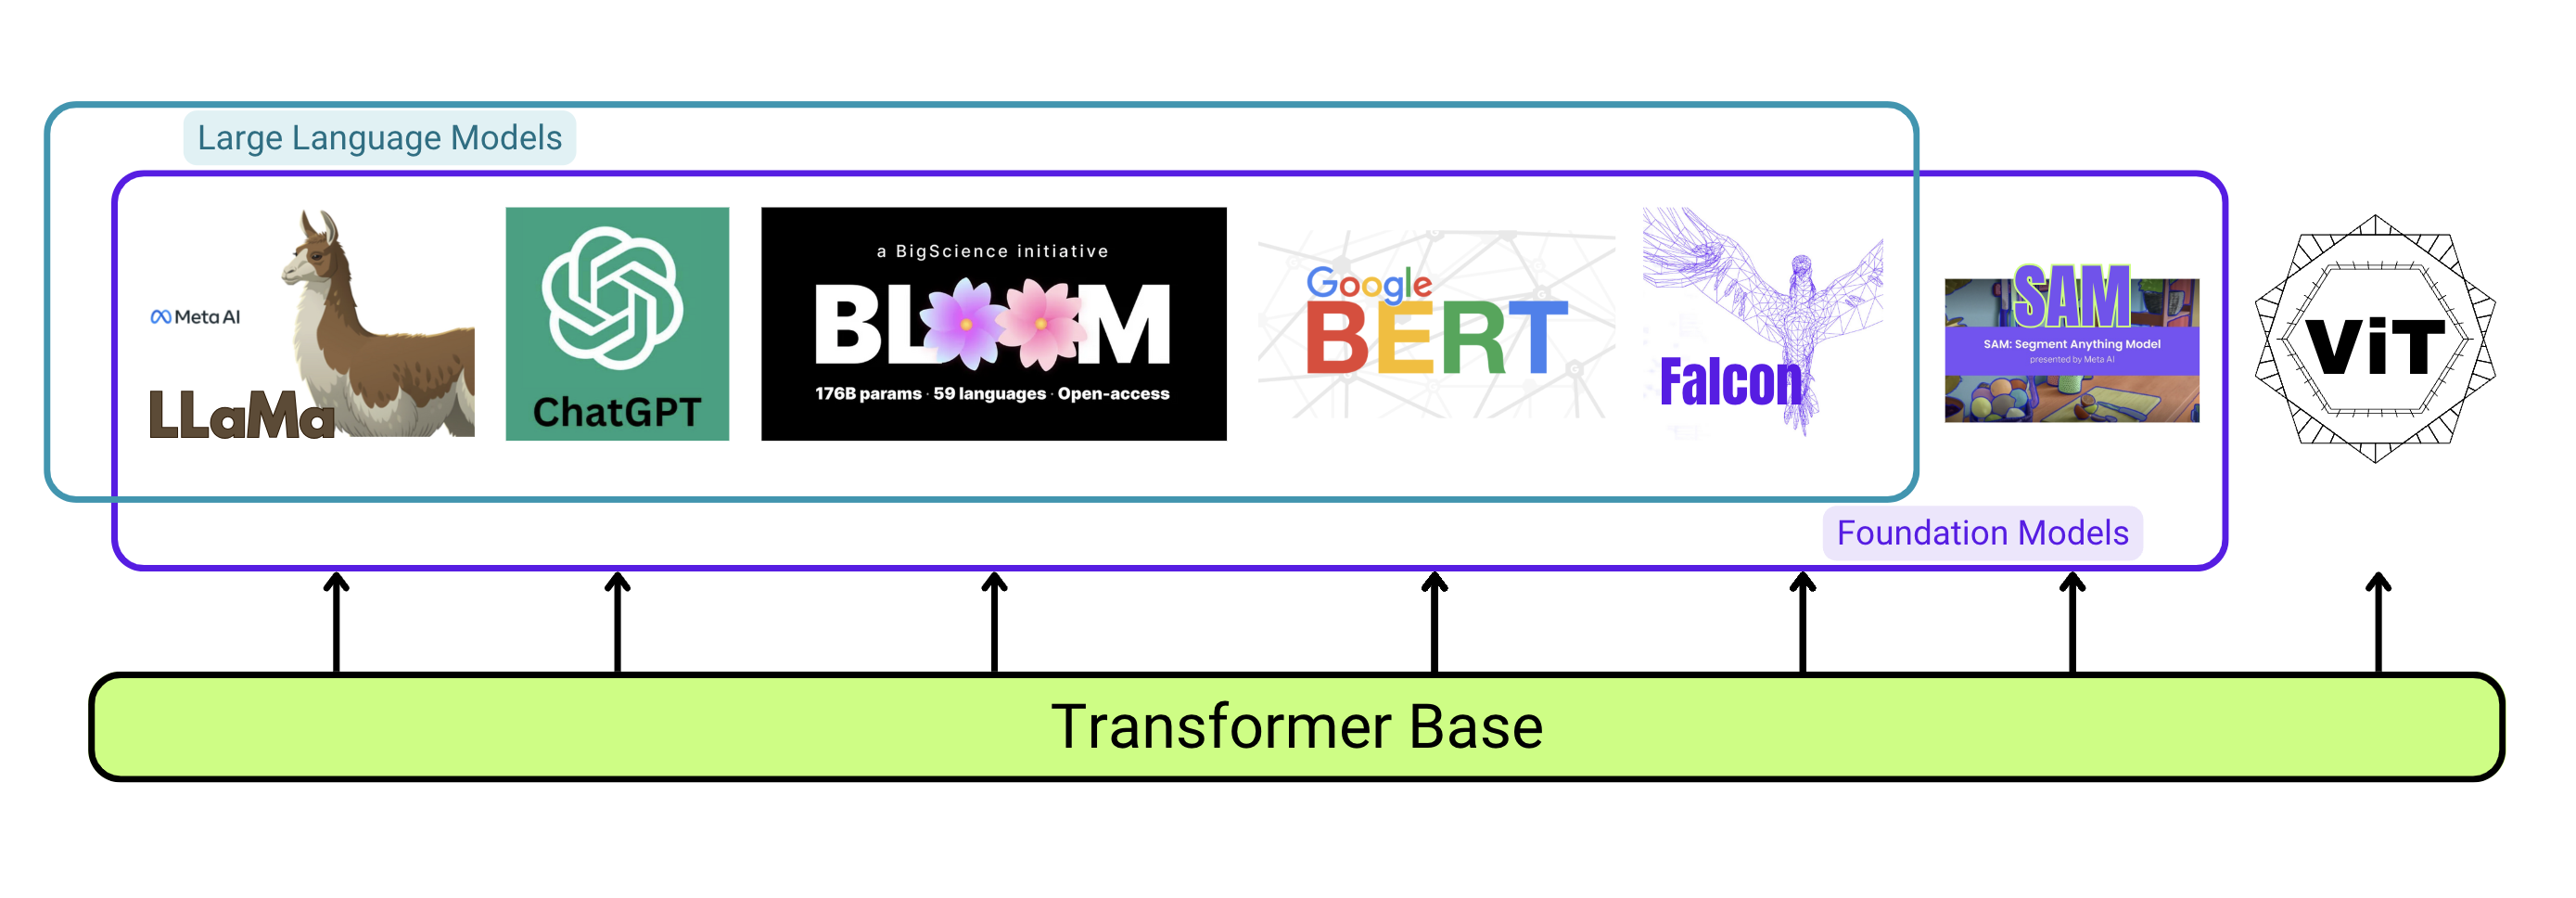
That’s a lot of information but the important takeaway here is that the key differentiating feature of the transformer model (and by extension all transformer-based foundational LLMs) is the concept of self-attention, which we’ll go over next.
Attention
Generally speaking, attention describes the ability of a model to pay attention to the important parts of a sentence (or image, or any other sequential input). It does this by assigning weights to input features based on their importance and their position in the sequence.
Remember that attention was the concept that improved the performance of previous NLP models (like RNNs and LSTMs) by lending itself to parallelization. But attention isn’t just about optimization. It also plays a pivotal role in broadening the context a language model is able to consider while processing and generating language. This enables a model to produce contextually appropriate and coherent texts in much longer sequences.
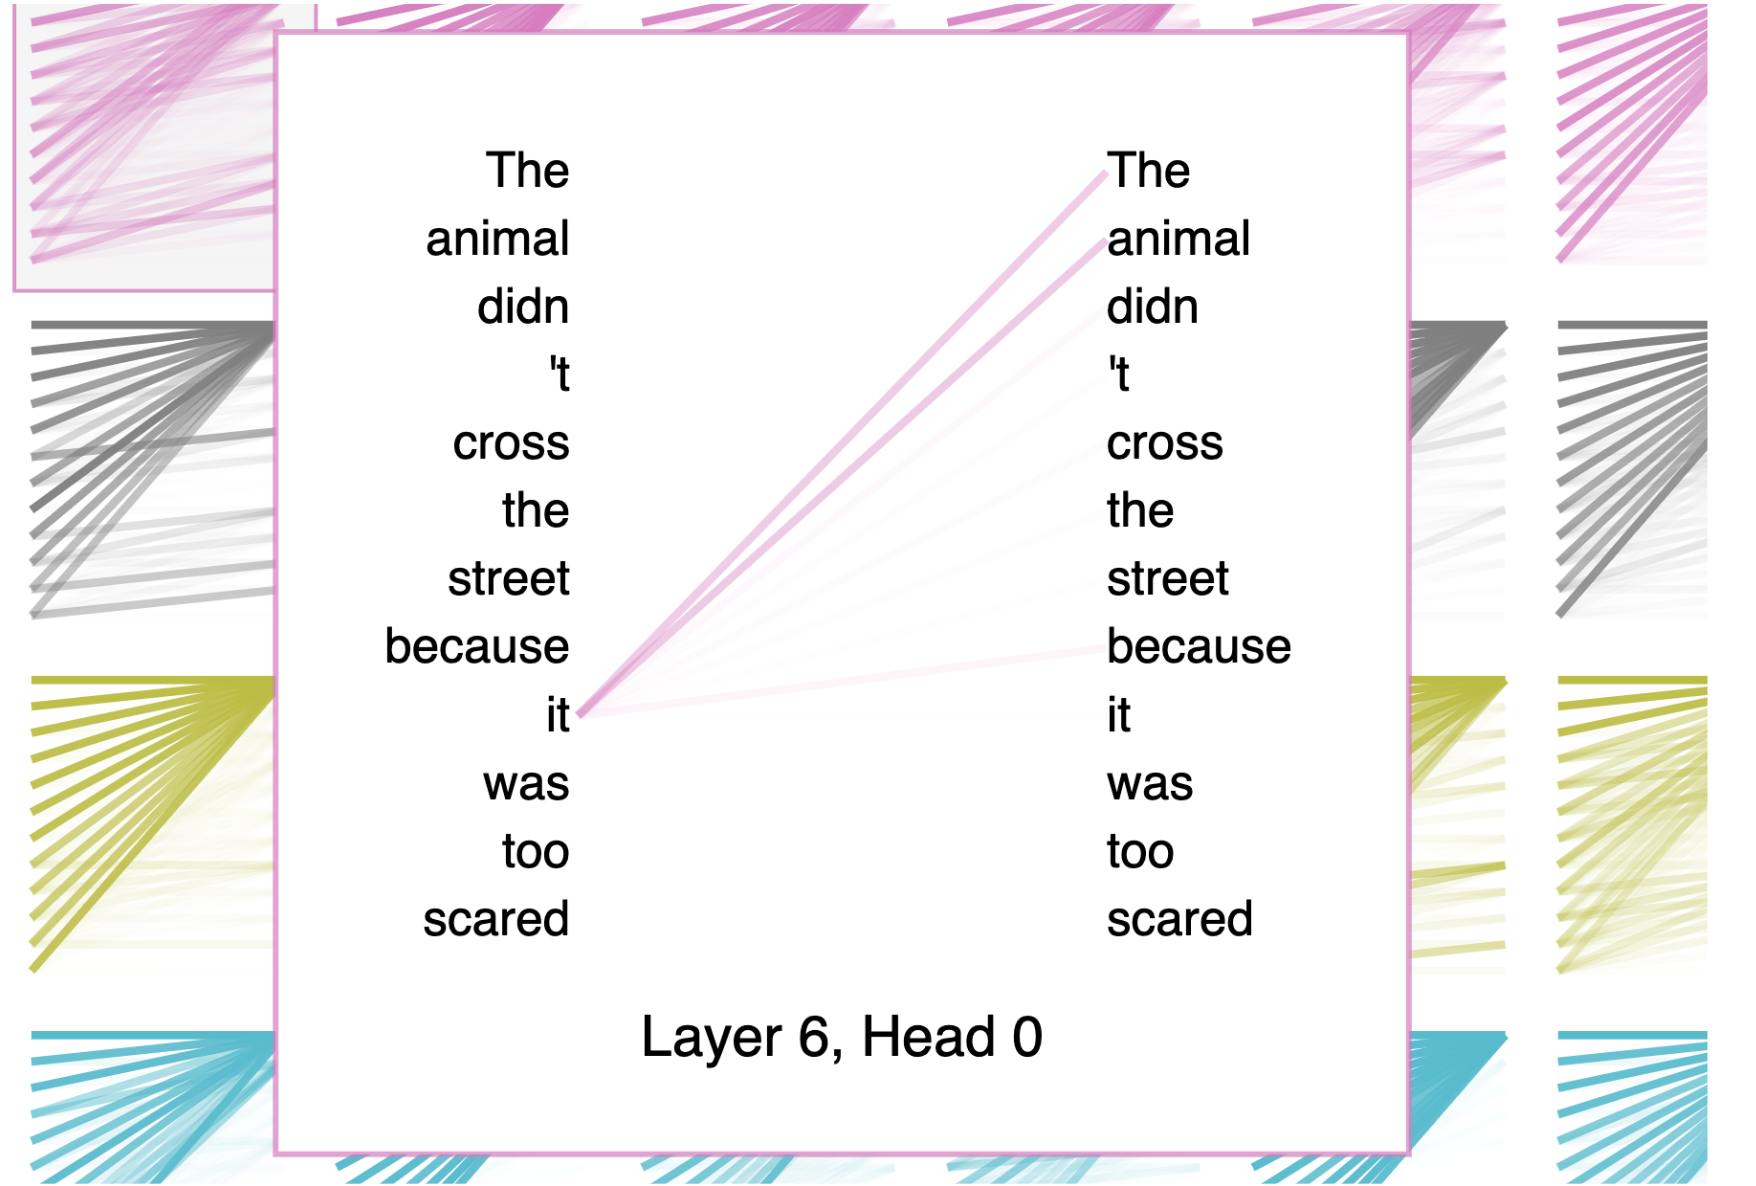
If we break transformers down into a “communication” phase and a “computation” phase, attention would represent the “communication” phase. In another analogy, attention is a lot like a search-retrieval problem, where given a query, q, we want to find the set of keys, k, most similar to q and return the corresponding values, v.
- Query: What are the things I am looking for?
- Key: What are the things that I have?
- Value: What are the things that I will communicate?

Types of attention
Self-attention refers to the fact that every node produces a key, query, and a value from that individual node. Multi-headed attention is just self-attention that is applied multiple times in parallel with different initialized weights. Cross-attention means that the queries are still produced from a given decoder node, but the keys and the values are produced as a function of the nodes in the encoder.
This is an oversimplified summary of transformer architectures, and we’ve glossed over quite a few details (like positional encodings and attention masks). For more information, check out the additional resources below.
Visualizing attention before BertViz
Transformers are not inherently interpretable, but there have been many attempts to contribute post-hoc explainability tools to attention-based models.
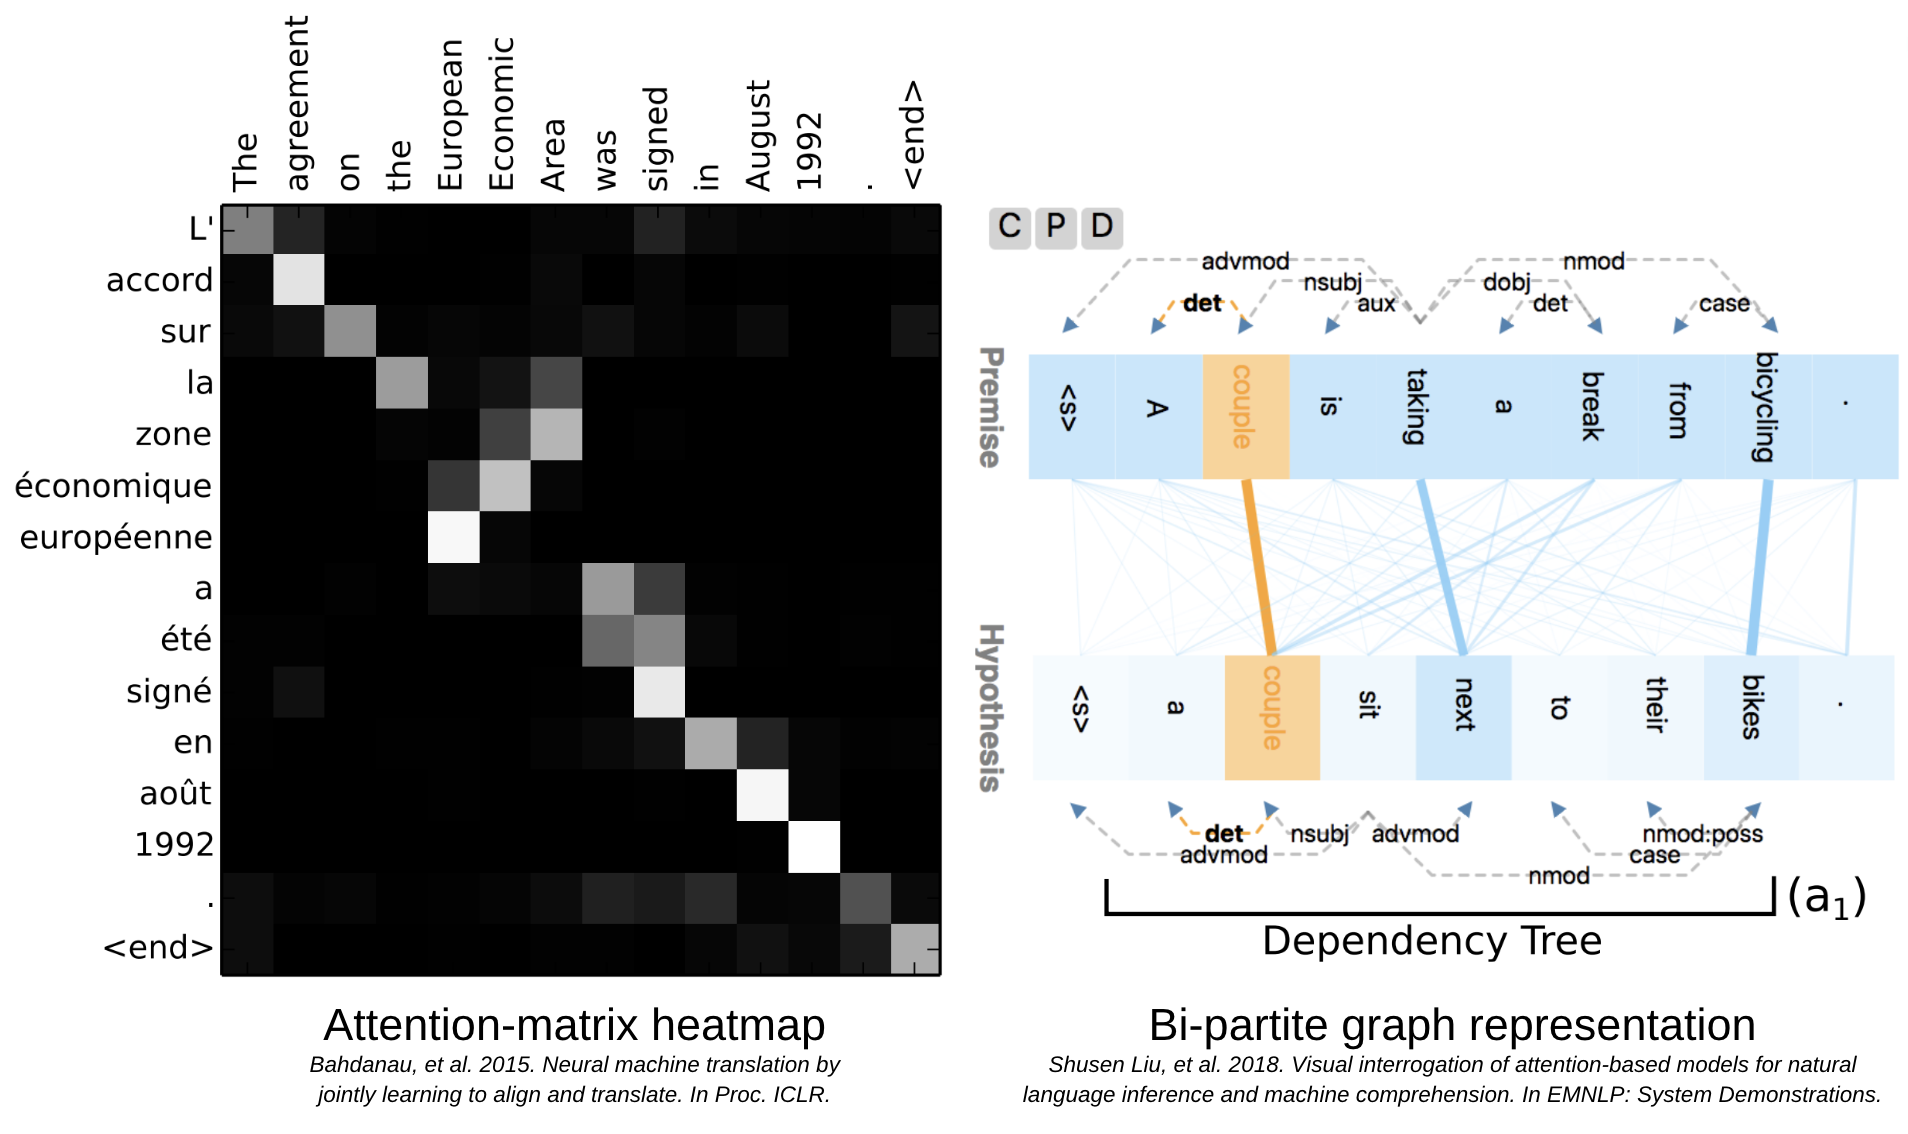
Previous attempts to visualize attention were often overly complicated and didn’t translate well to non-technical audiences. They could also vary greatly from project to project and use-case to use-case.
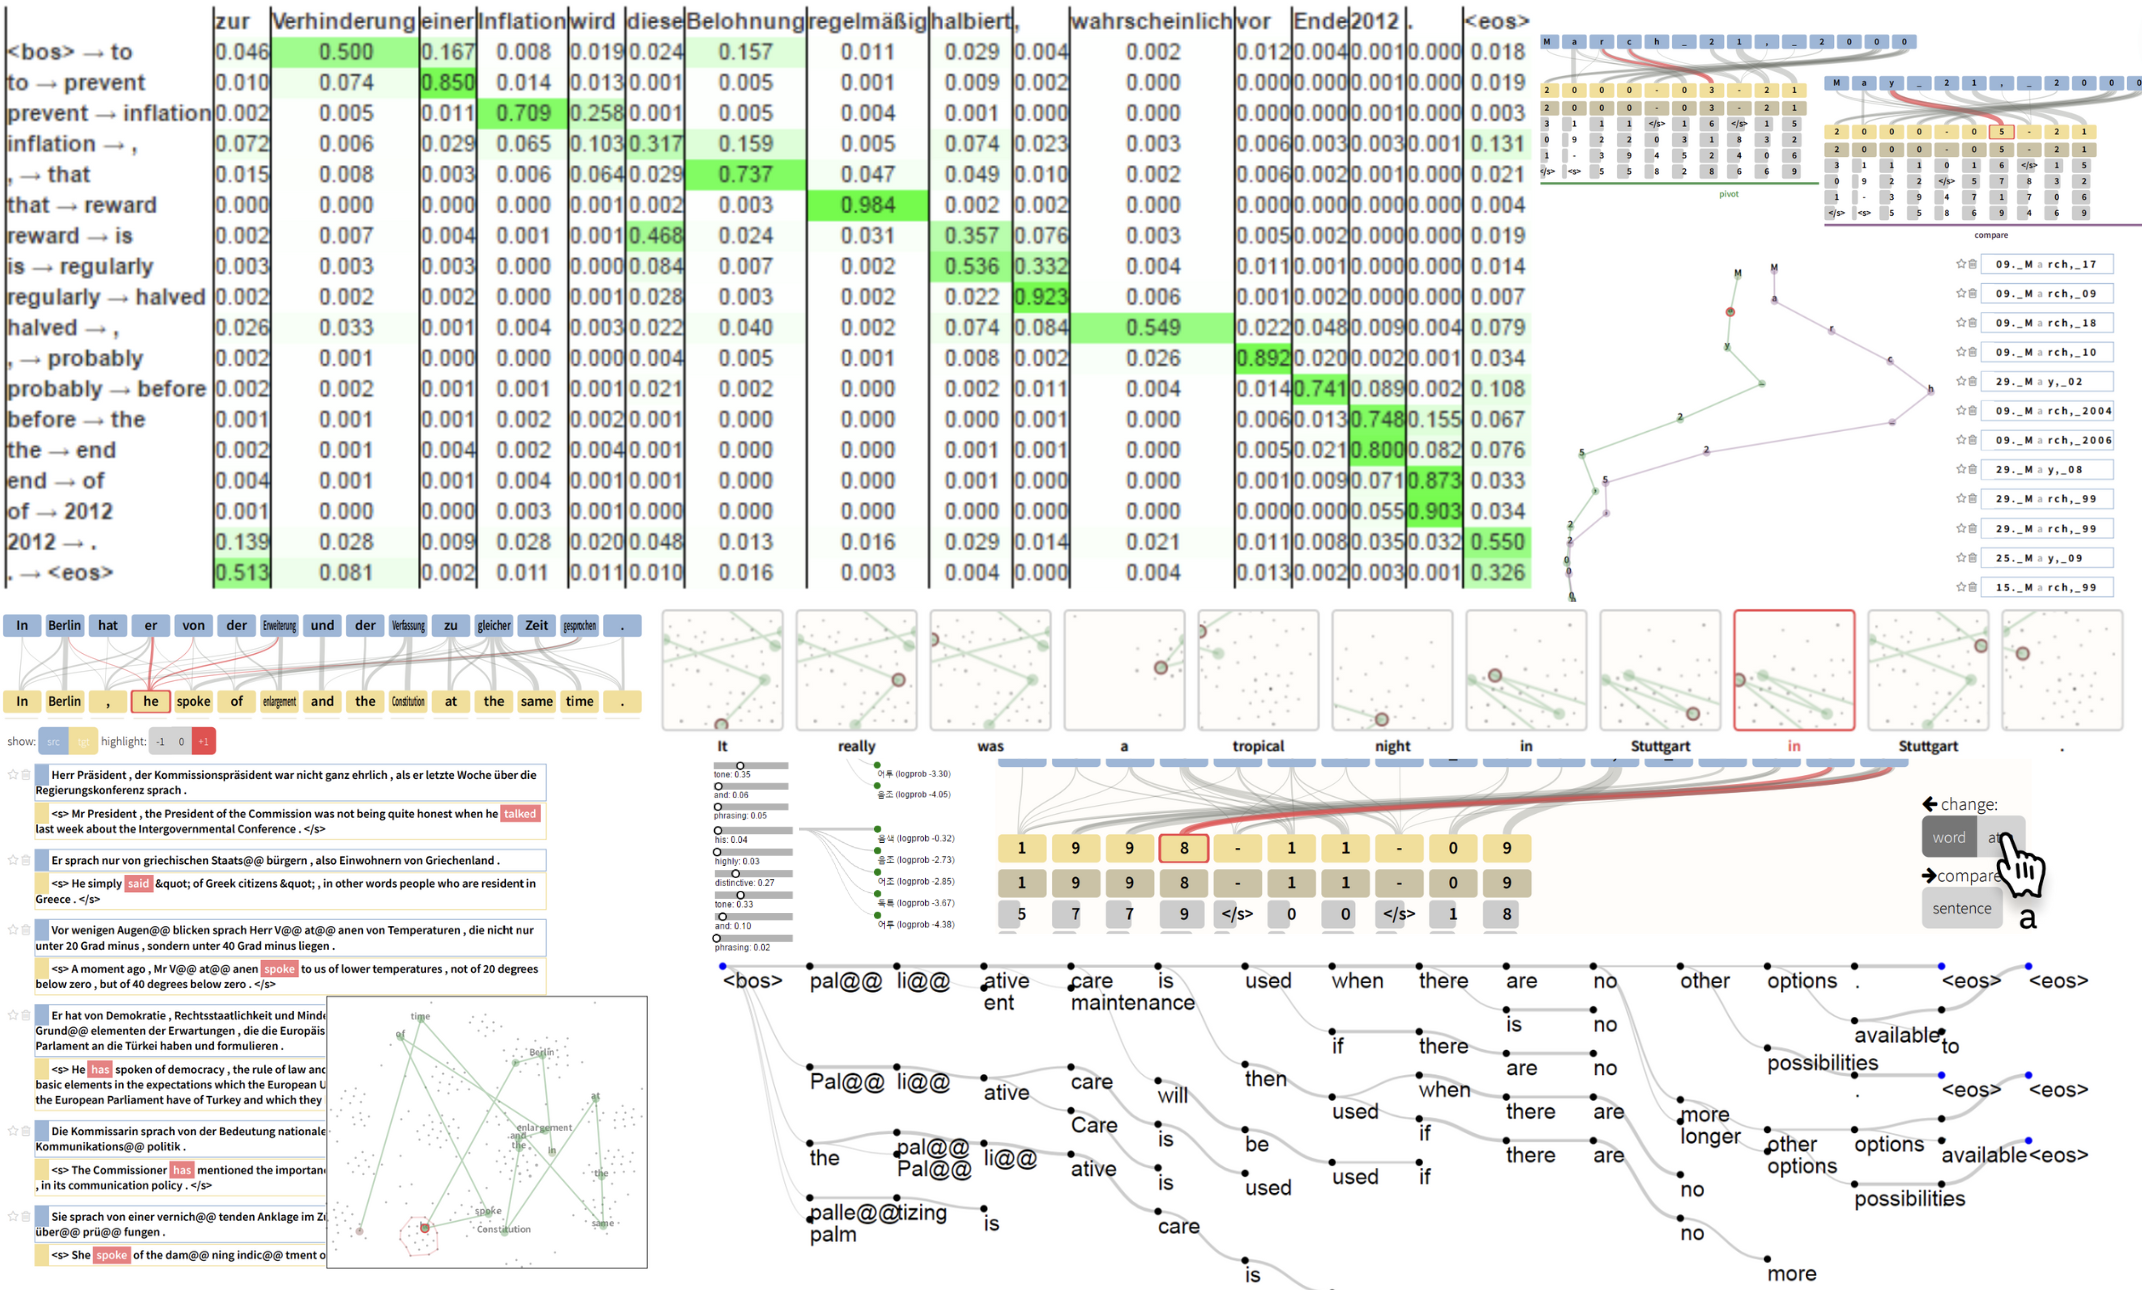
Some successful attempts to explain attention behavior included attention-matrix heat maps and bi-partite graph representations, both of which are still used today. But these methods also have some major limitations.
BertViz ultimately gained popularity for its ability to illustrate low-level, granular details of self-attention, while still remaining remarkably simple and intuitive to use.
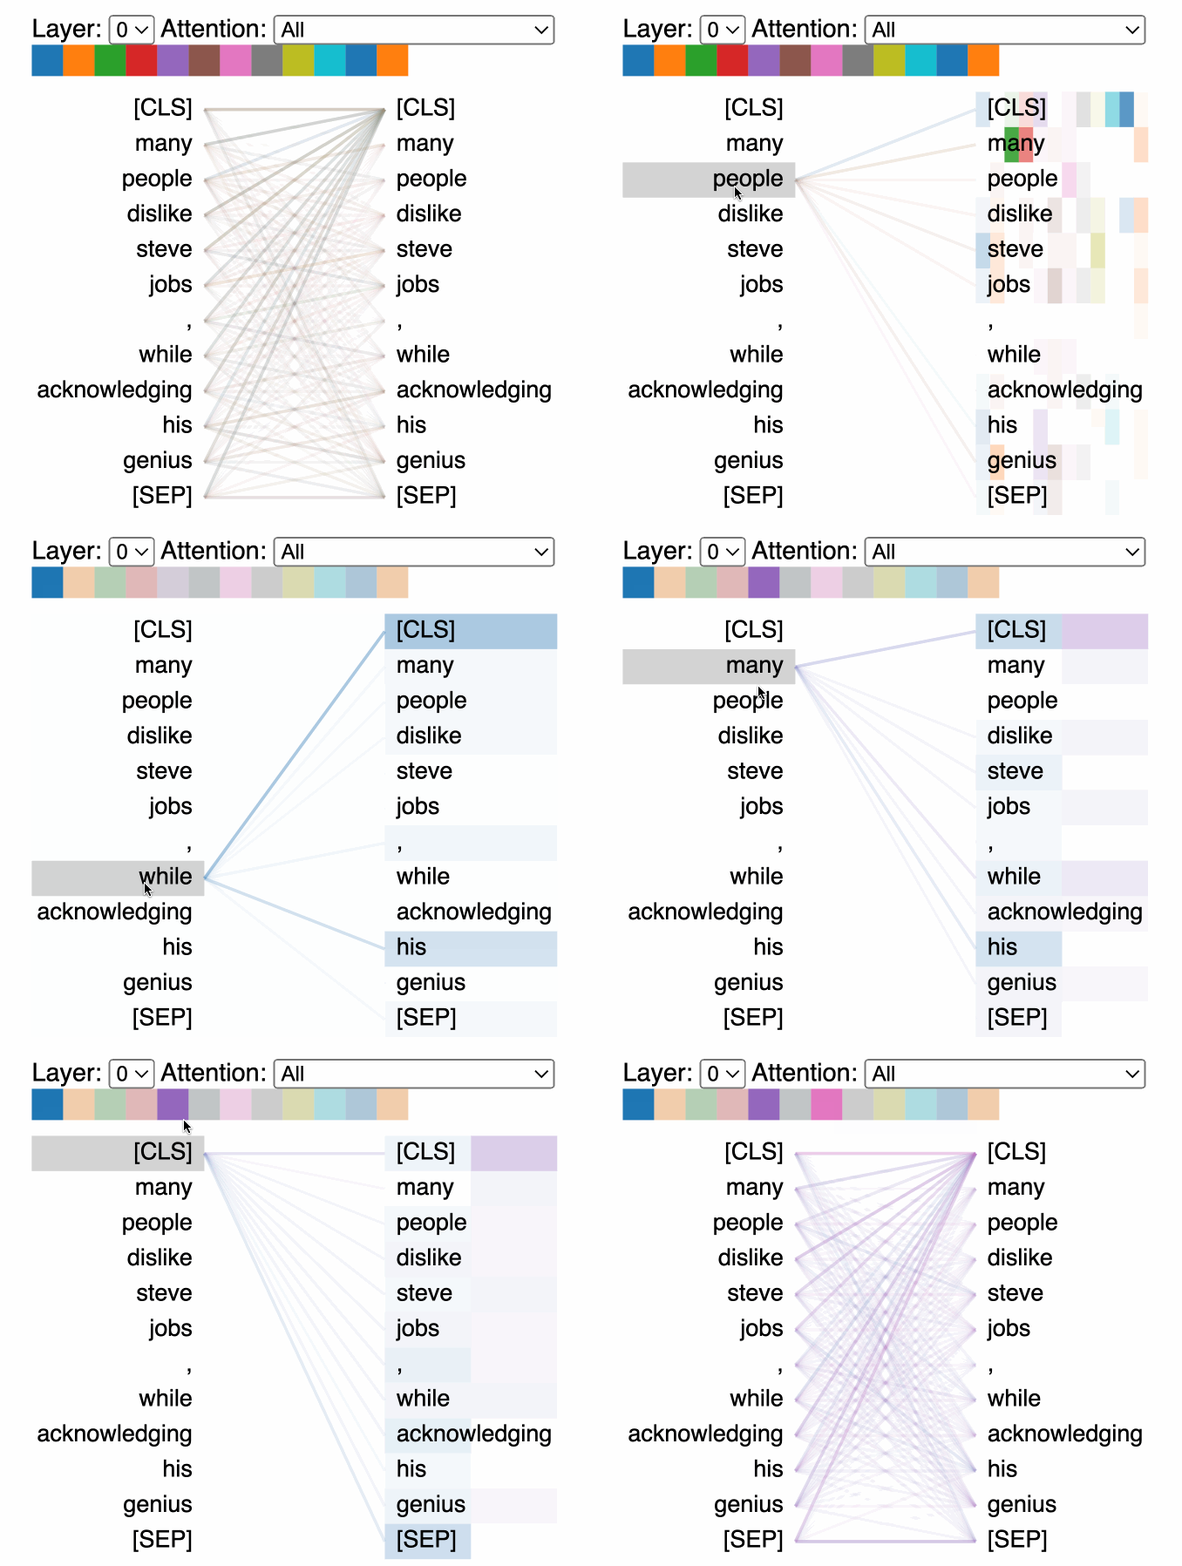
That’s a nice, clean visualization. But, what are we actually looking at?
How BertViz Breaks It All Down
BertViz visualizes the attention mechanism at multiple local scales: the neuron-level, attention head-level, and model-level. Below we break down what that means, starting from the lowest, most granular level, and making our way up.

Visualizing BertViz With Comet
We’ll log our BertViz plots to Comet, an experiment tracking tool, so we can compare our results later on. To get started with Comet, create a free account here, grab your API key, and run the following code:
Visualizing attention in Comet will help us interpret our models’ decisions by showing how they attend to different parts of the input. In this tutorial, we’ll use these visualizations to compare and dissect the performance of several pre-trained LLMs. But these visualizations can also be used during fine-tuning for debugging purposes.
To add BertViz to your dashboard, navigate to Comet’s public panels and select either ‘Transformers Model Viewer’ or ‘Transformers Attention Head Viewer.’
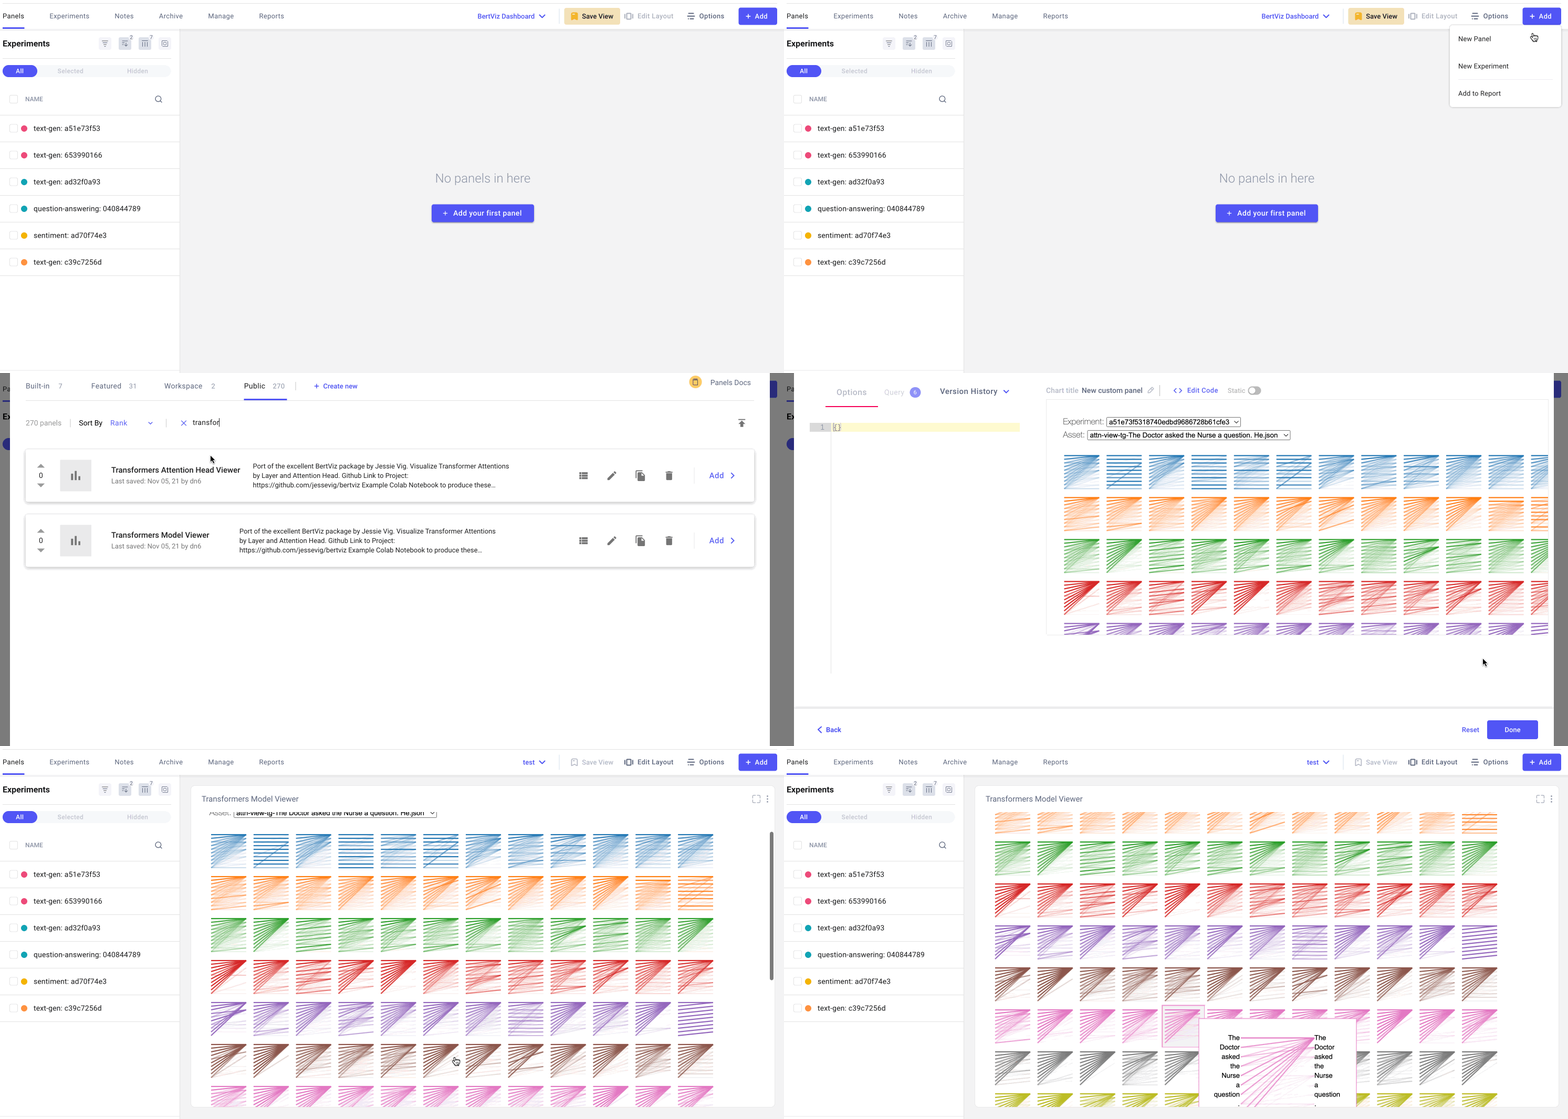
We’ll define some functions to parse our models results and log the attention information to Comet. See the Colab tutorial to get the full code used. Then, we’ll run the following commands to start logging our data to Comet:
Text generation example
Question-answering example
Sentiment analysis example
Neuron View
At the lowest level, BertViz visualizes the query, key, and value embeddings used to compute attention in a neuron. Given a selected token, this view traces the computation of attention from that token to the other tokens in the sequence.
In the GIF below, positive values are colored blue and negative values are colored orange, with color intensity reflecting the magnitude of the value. Connecting lines are weighted based on the attention score between respective words.
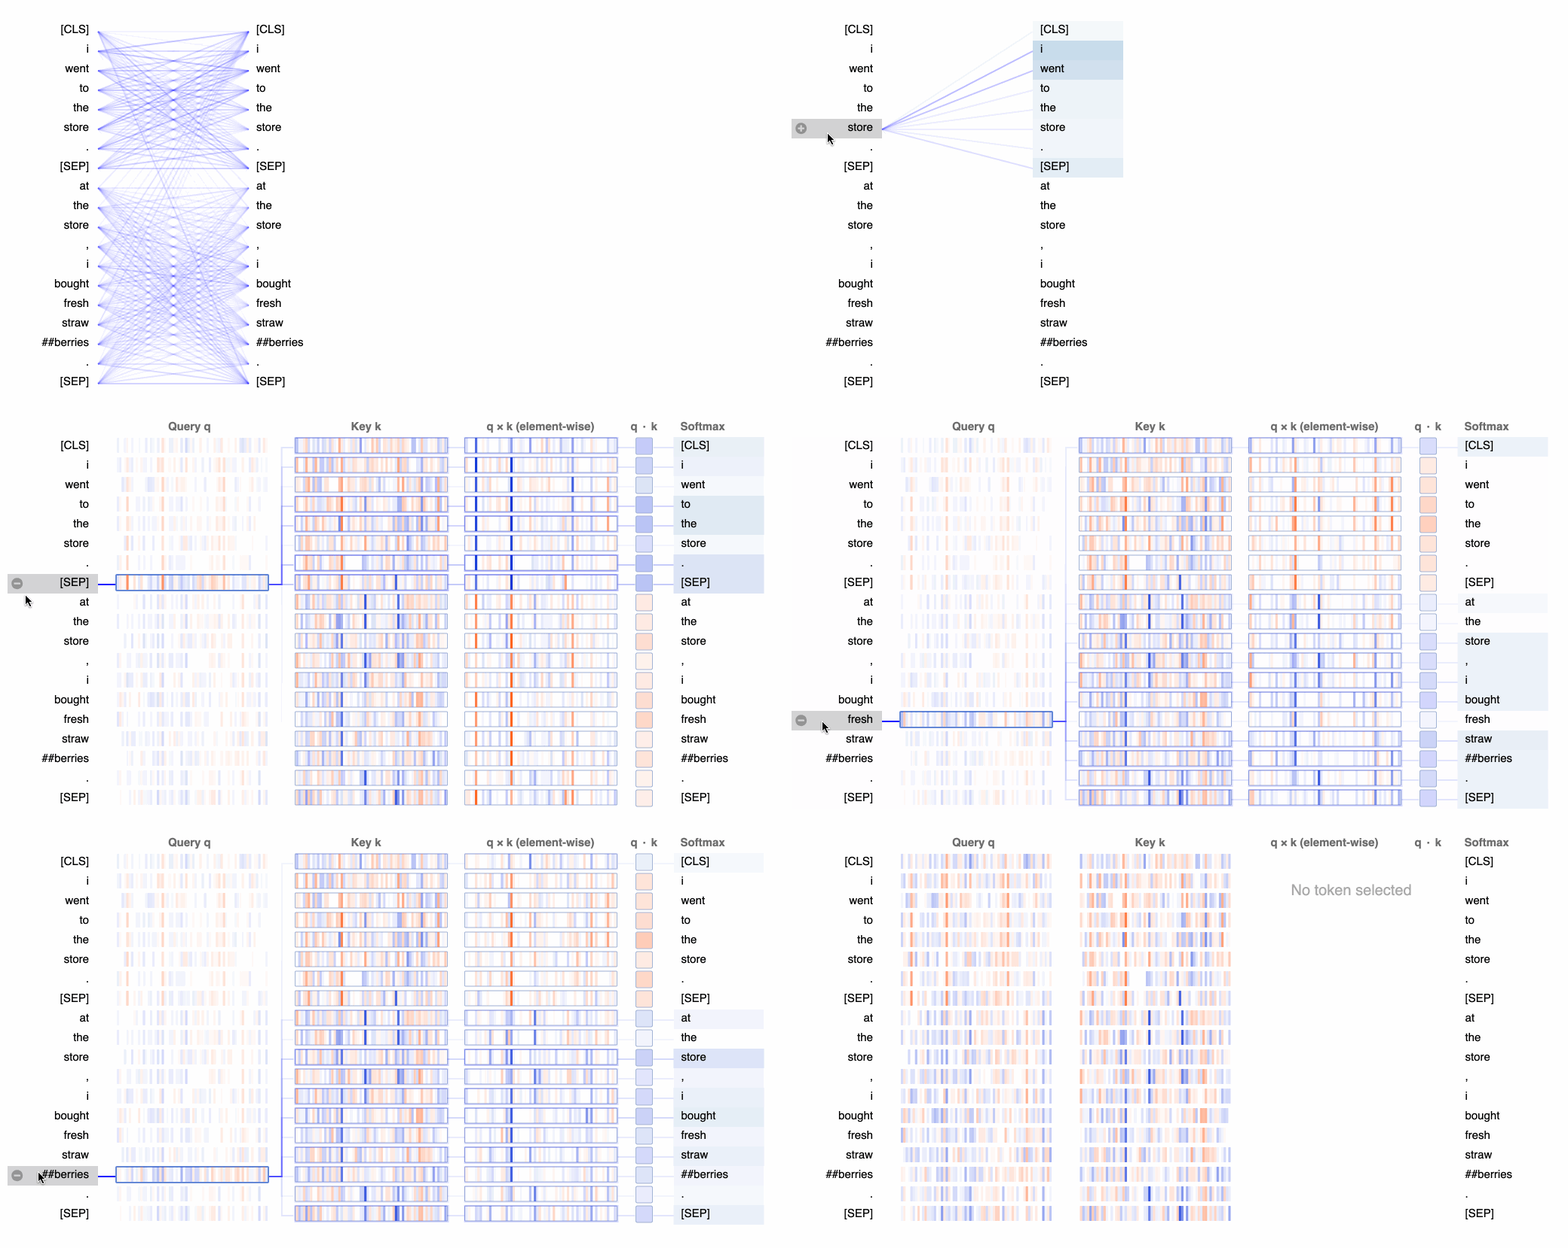
Whereas the views in the following two sections will show what attention patterns the model learns, this neuron view shows how those patterns are learned. The neuron view is a bit more granular than we need to get for this particular tutorial, but for a deeper dive, we could use this view to link neurons to specific attention patterns and, more generally, to model behavior.
It’s important to note that it isn’t entirely clear what relationships exist between attention weights and model outputs. Some, like Jain et al. in Attention Is Not Explanation, claim that standard attention modules should not be treated as though they provide meaningful explanations for predictions. They propose no alternatives, however, and BertViz remains one of the most popular attention visualization tools today.
Head View
The attention-head view shows how attention flows between tokens within the same transformer layer by uncovering patterns between attention heads. In this view, the tokens on the left are attending to the tokens on the right and attention is represented as a line connecting each token pair. Colors correspond to attention heads and line thickness represents the attention weight.
In the drop-down menu, we can select the experiment we’d like to visualize, and if we logged more than one asset to our experiment, we can also select our asset. We can then choose which attention layer we’d like to visualize and, optionally, we can choose any combination of attention heads we’d like to see. Note that color intensity of the lines connecting tokens corresponds to the attention weights between tokens.
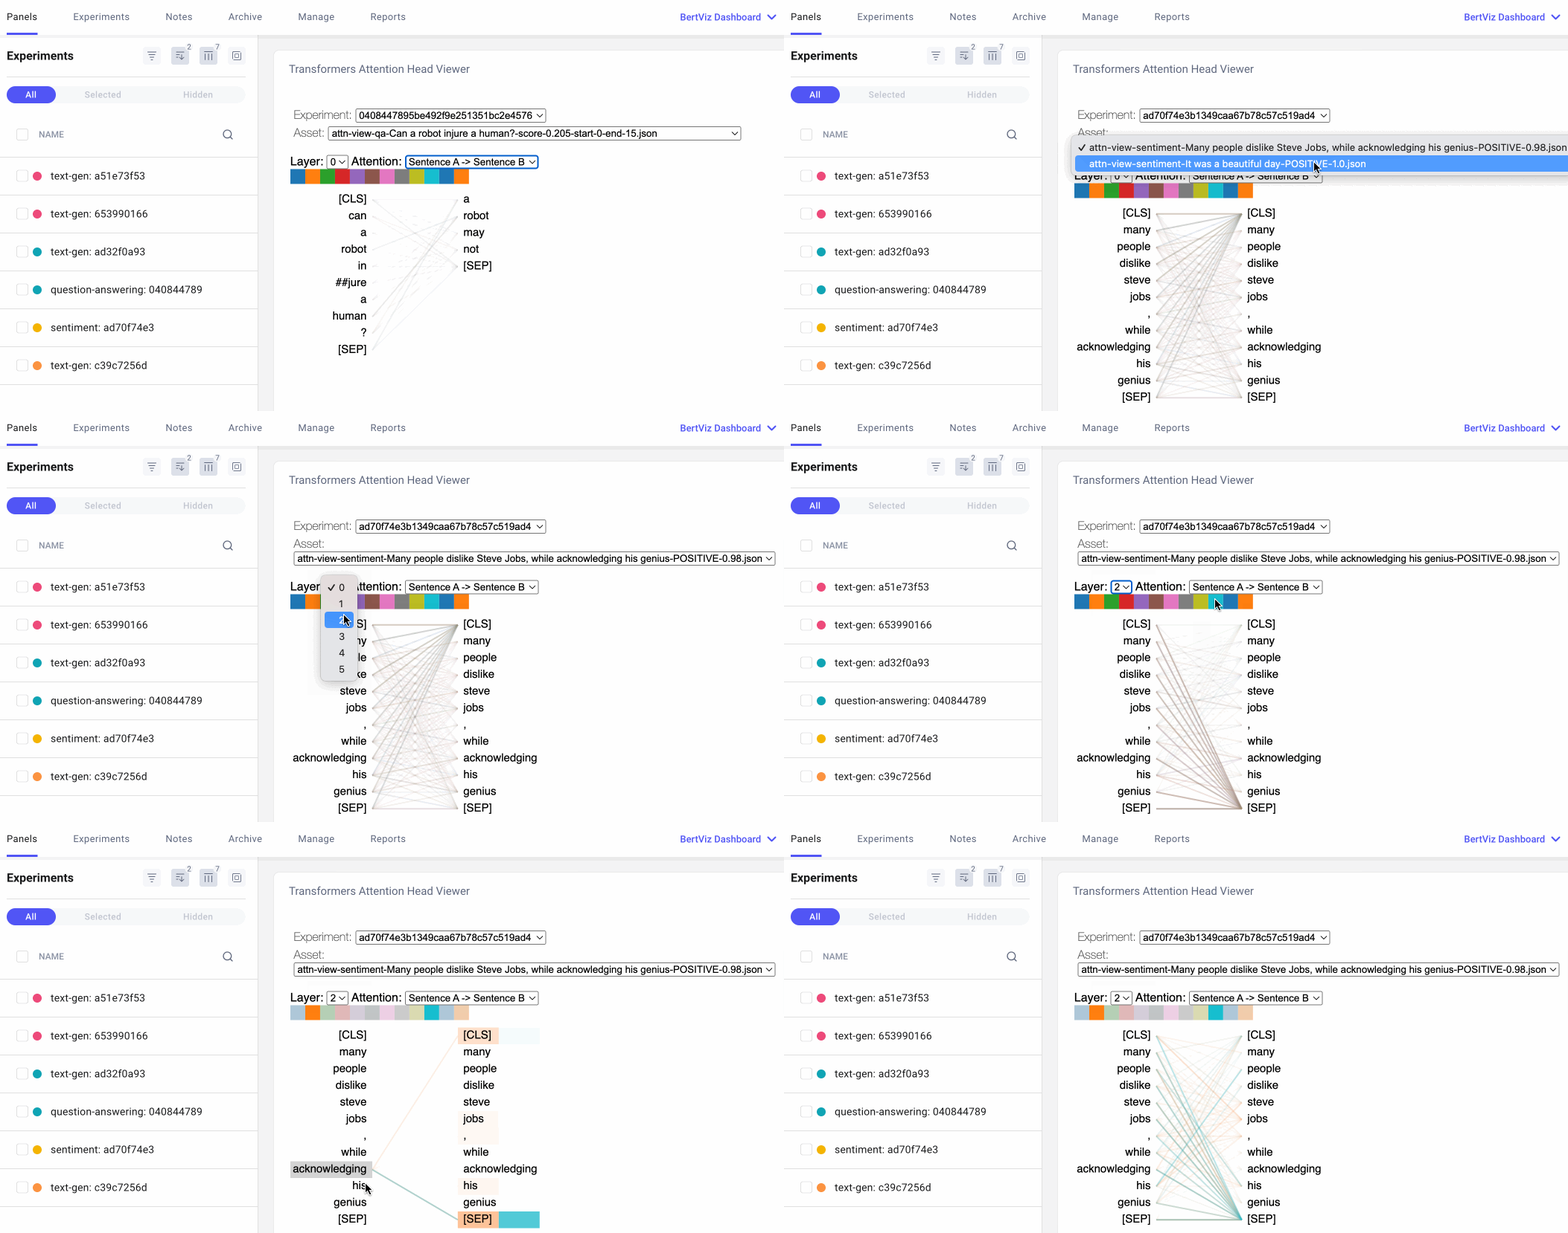
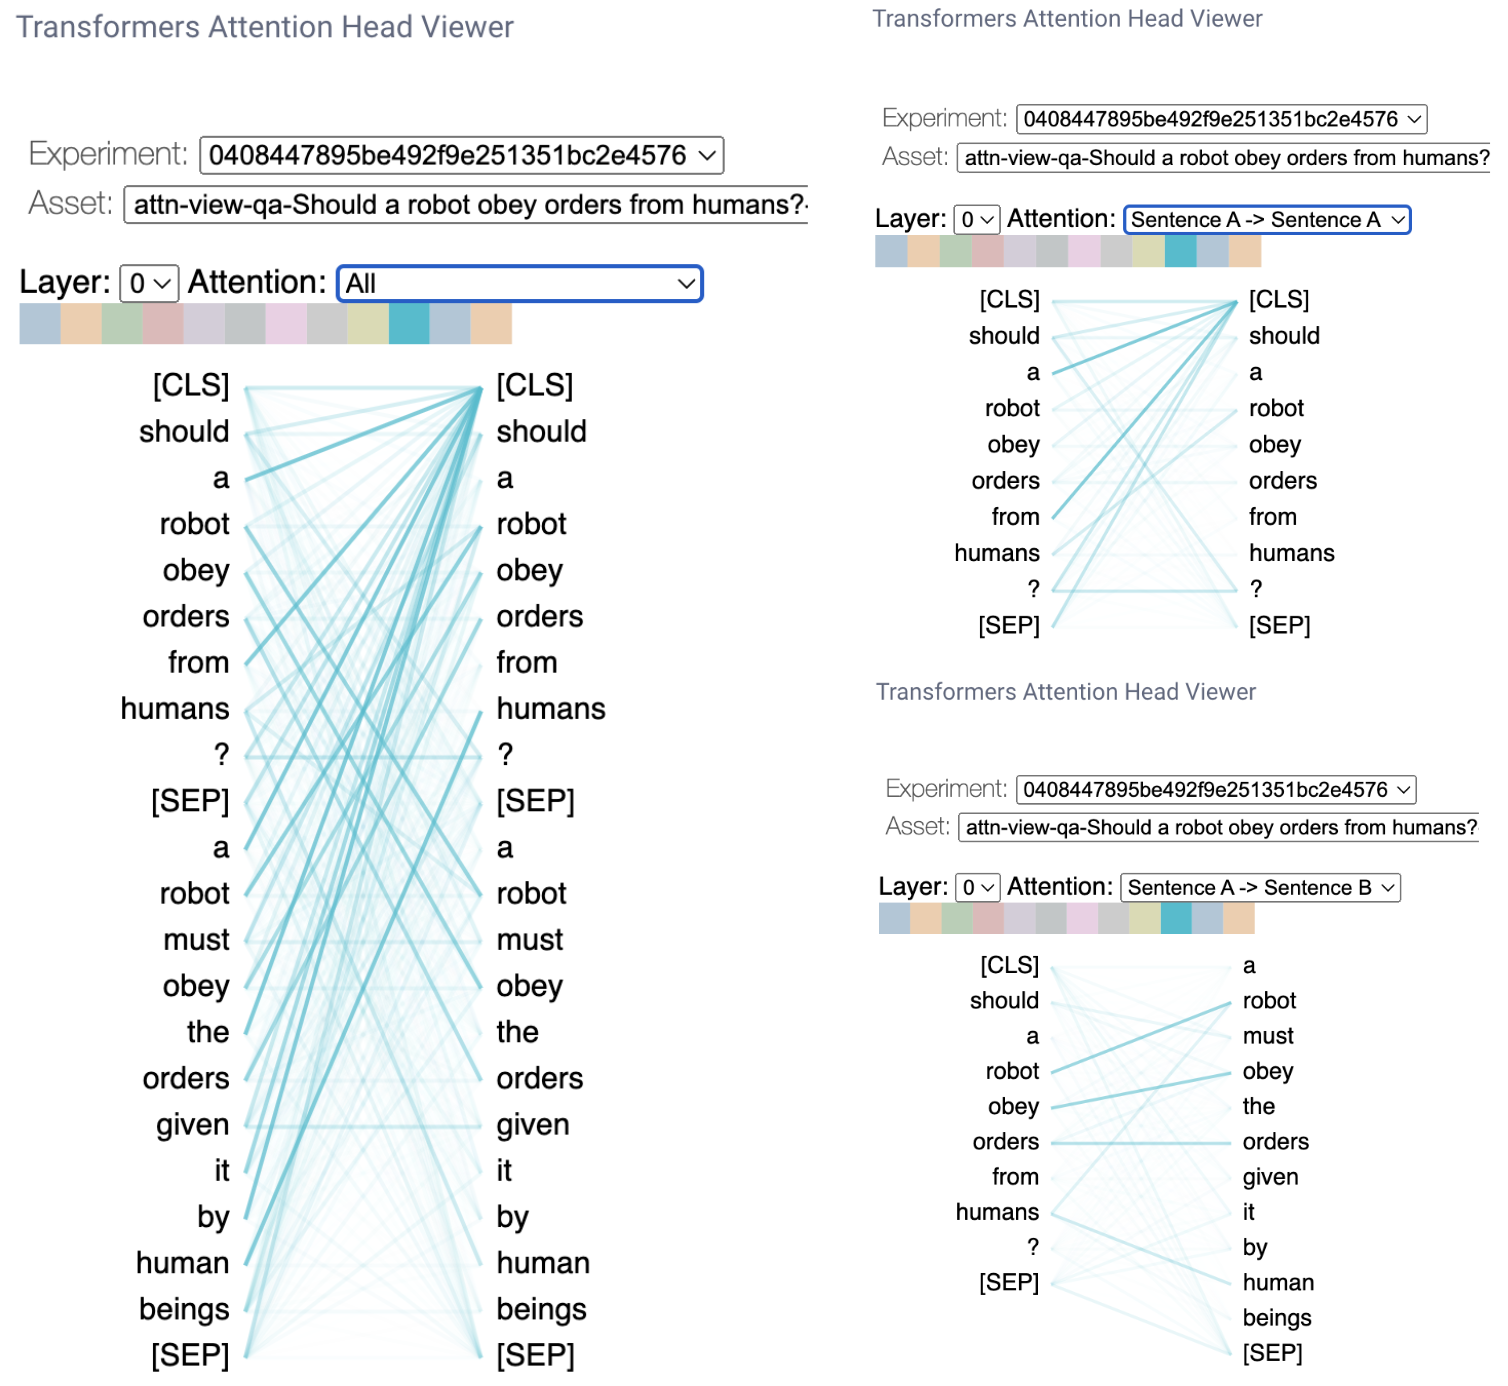
We can also specify how we’d like our tokens to be formatted. For the question-answering example below, we’ll select “Sentence A → Sentence B” so we can examine the attention between question and answer:
Attention head patterns
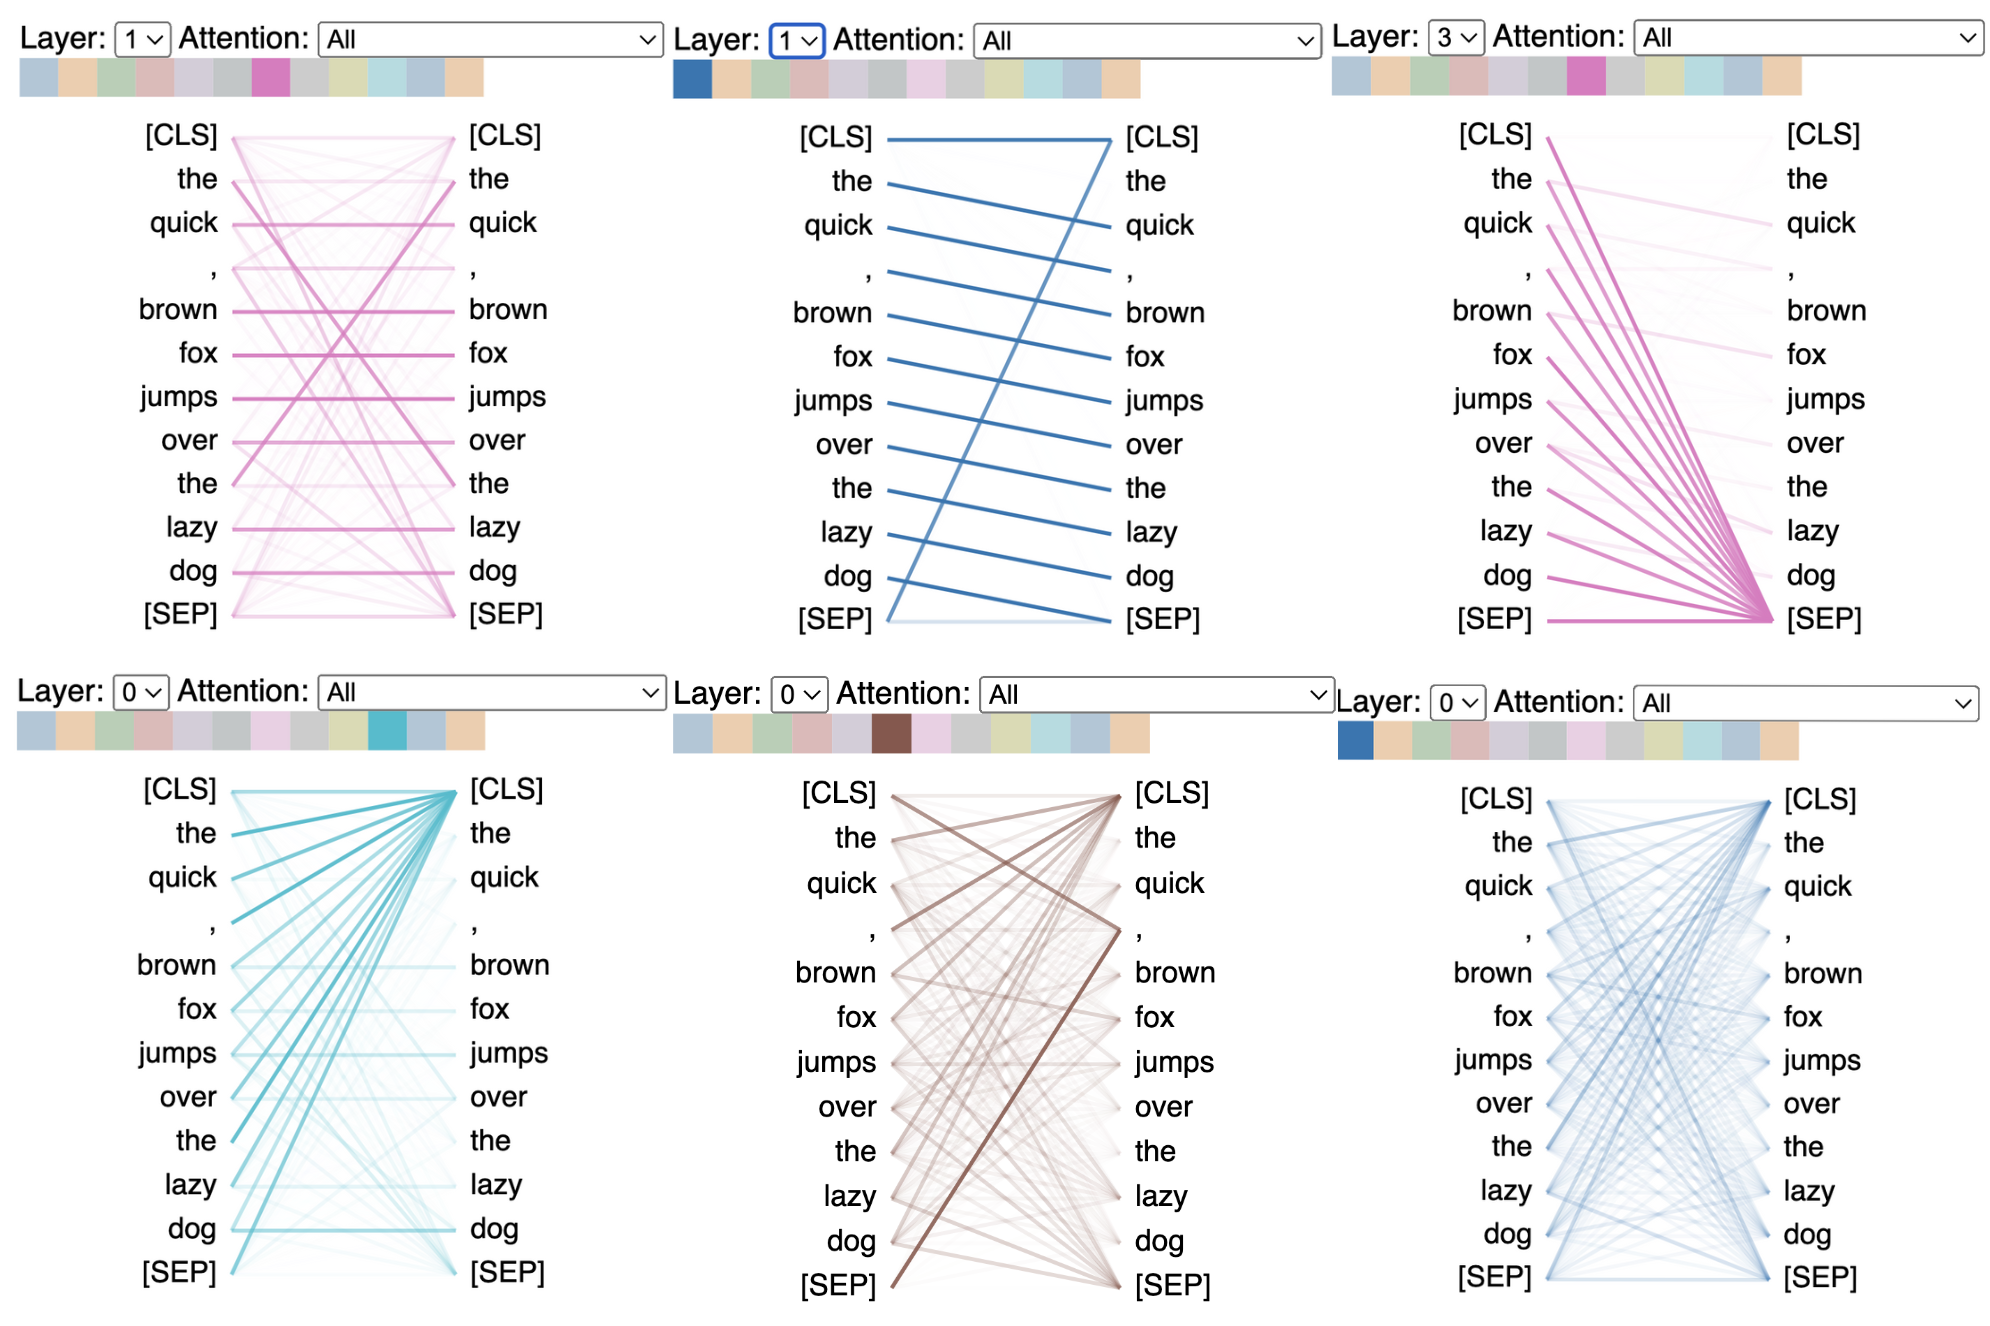
Attention heads do not share parameters, so each head learns a unique attention mechanism. In the graphic below, attention heads are examined across layers of the same model given one input. We can see that different attention heads seem to focus on very unique patterns.
On the top left, attention is strongest between identical words (note the crossover where the two instances of “the” intersect). In the top center, there’s a focus on the next word in the sentence. On the top right and bottom left, the attention heads are focusing on each of the delimiters ([SEP] and [CLS], respectively). The bottom center places emphasis on the comma. And the bottom right is almost a bag-of-words pattern.
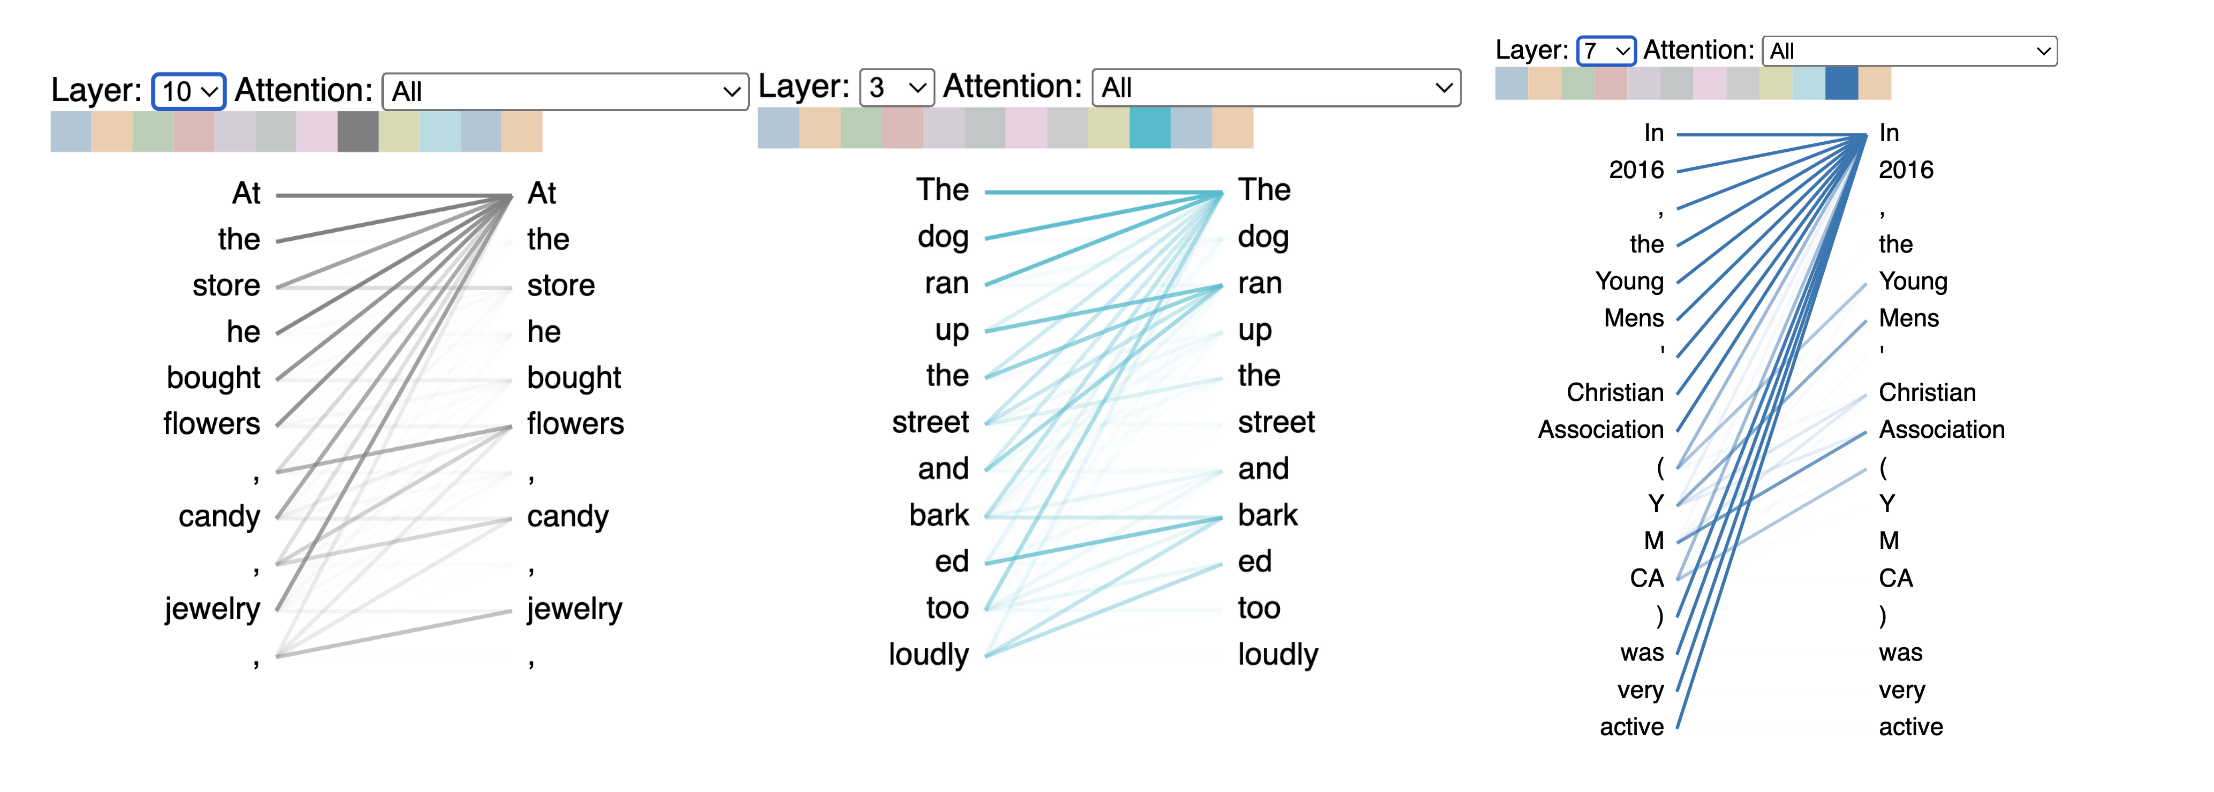
Attention heads also capture lexical patterns. In the following graphic, we can see examples of attention heads that focus on list items (left), verbs (center), and acronyms (on the right).
Attention head biases
One application of the head view is detecting model bias. If we provide our model (in this case GPT-2) with two inputs that are identical except for the final pronouns, we get very different generated outputs:
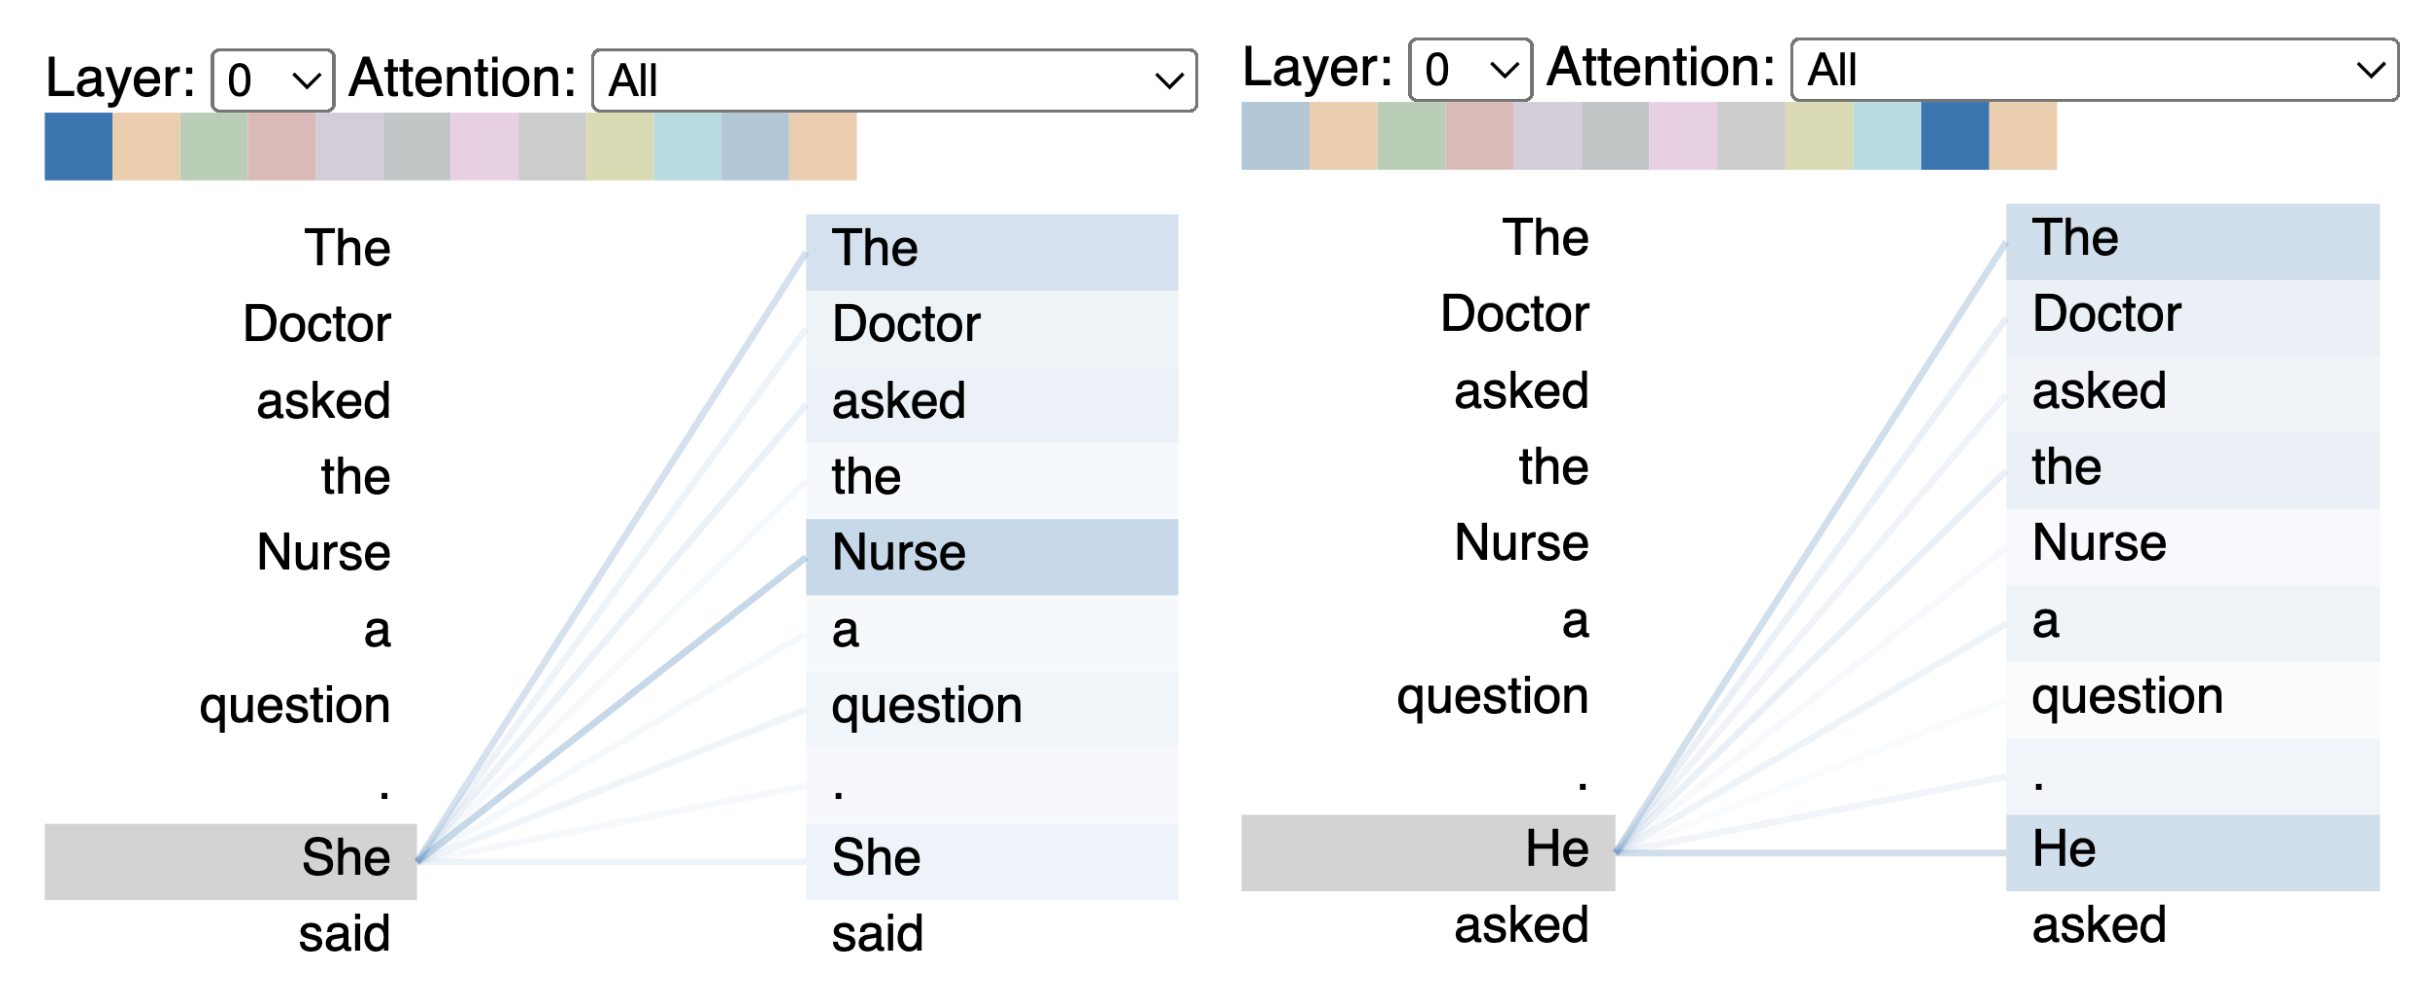
The model is assuming that “he” refers to the doctor, and “she” to the nurse, which might suggest that the co-reference mechanism is encoding gender bias. We would hope that by identifying a source of bias, we can potentially work to counteract it (perhaps with additional training data).
Model View
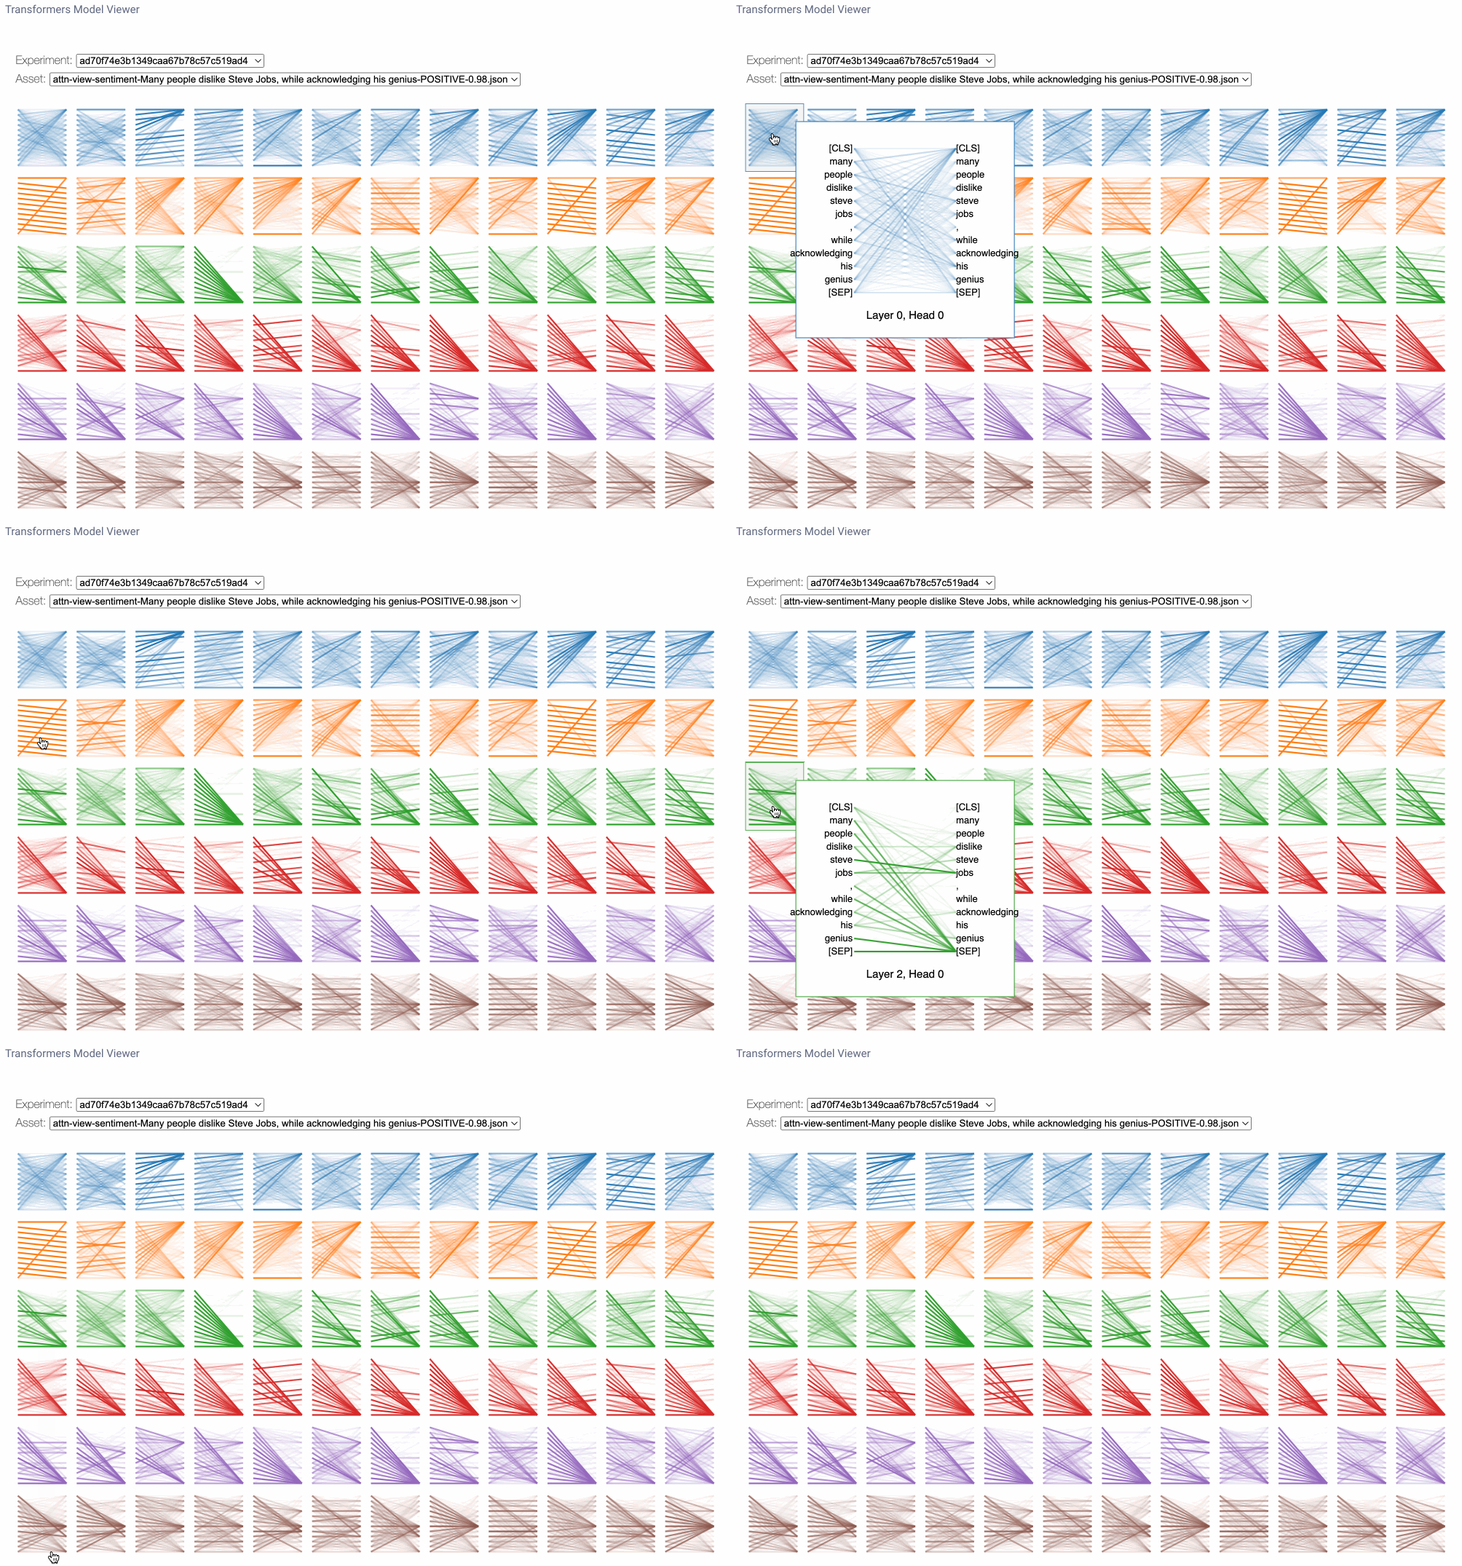
The model view is a bird’s-eye perspective of attention across all layers and heads. Here we may notice attention patterns across layers, illustrating the evolution of attention patterns from input to output. Each row of figures represents an attention layer and each column represents individual attention heads. To enlarge the figure for any particular head, we can simply click on it. Note that you can find the same line pattern in the model view as in the head view.
Model view applications
So, how might we use the model view? Firstly, because each layer is initialized with separate, independent weights, the layers that focus on specific patterns for one sentence may focus on different patterns for another sentence. So we can’t necessarily look at the same attention heads for the same patterns across experiment runs. With the model view we can more generally identify which layers may be focusing on areas of interest for a given sentence. Note that this is a very inexact science and, as many have mentioned, “if you look for it, you will find it.” Nonetheless, this view does give us some interesting insight as to what the model may be focusing on.
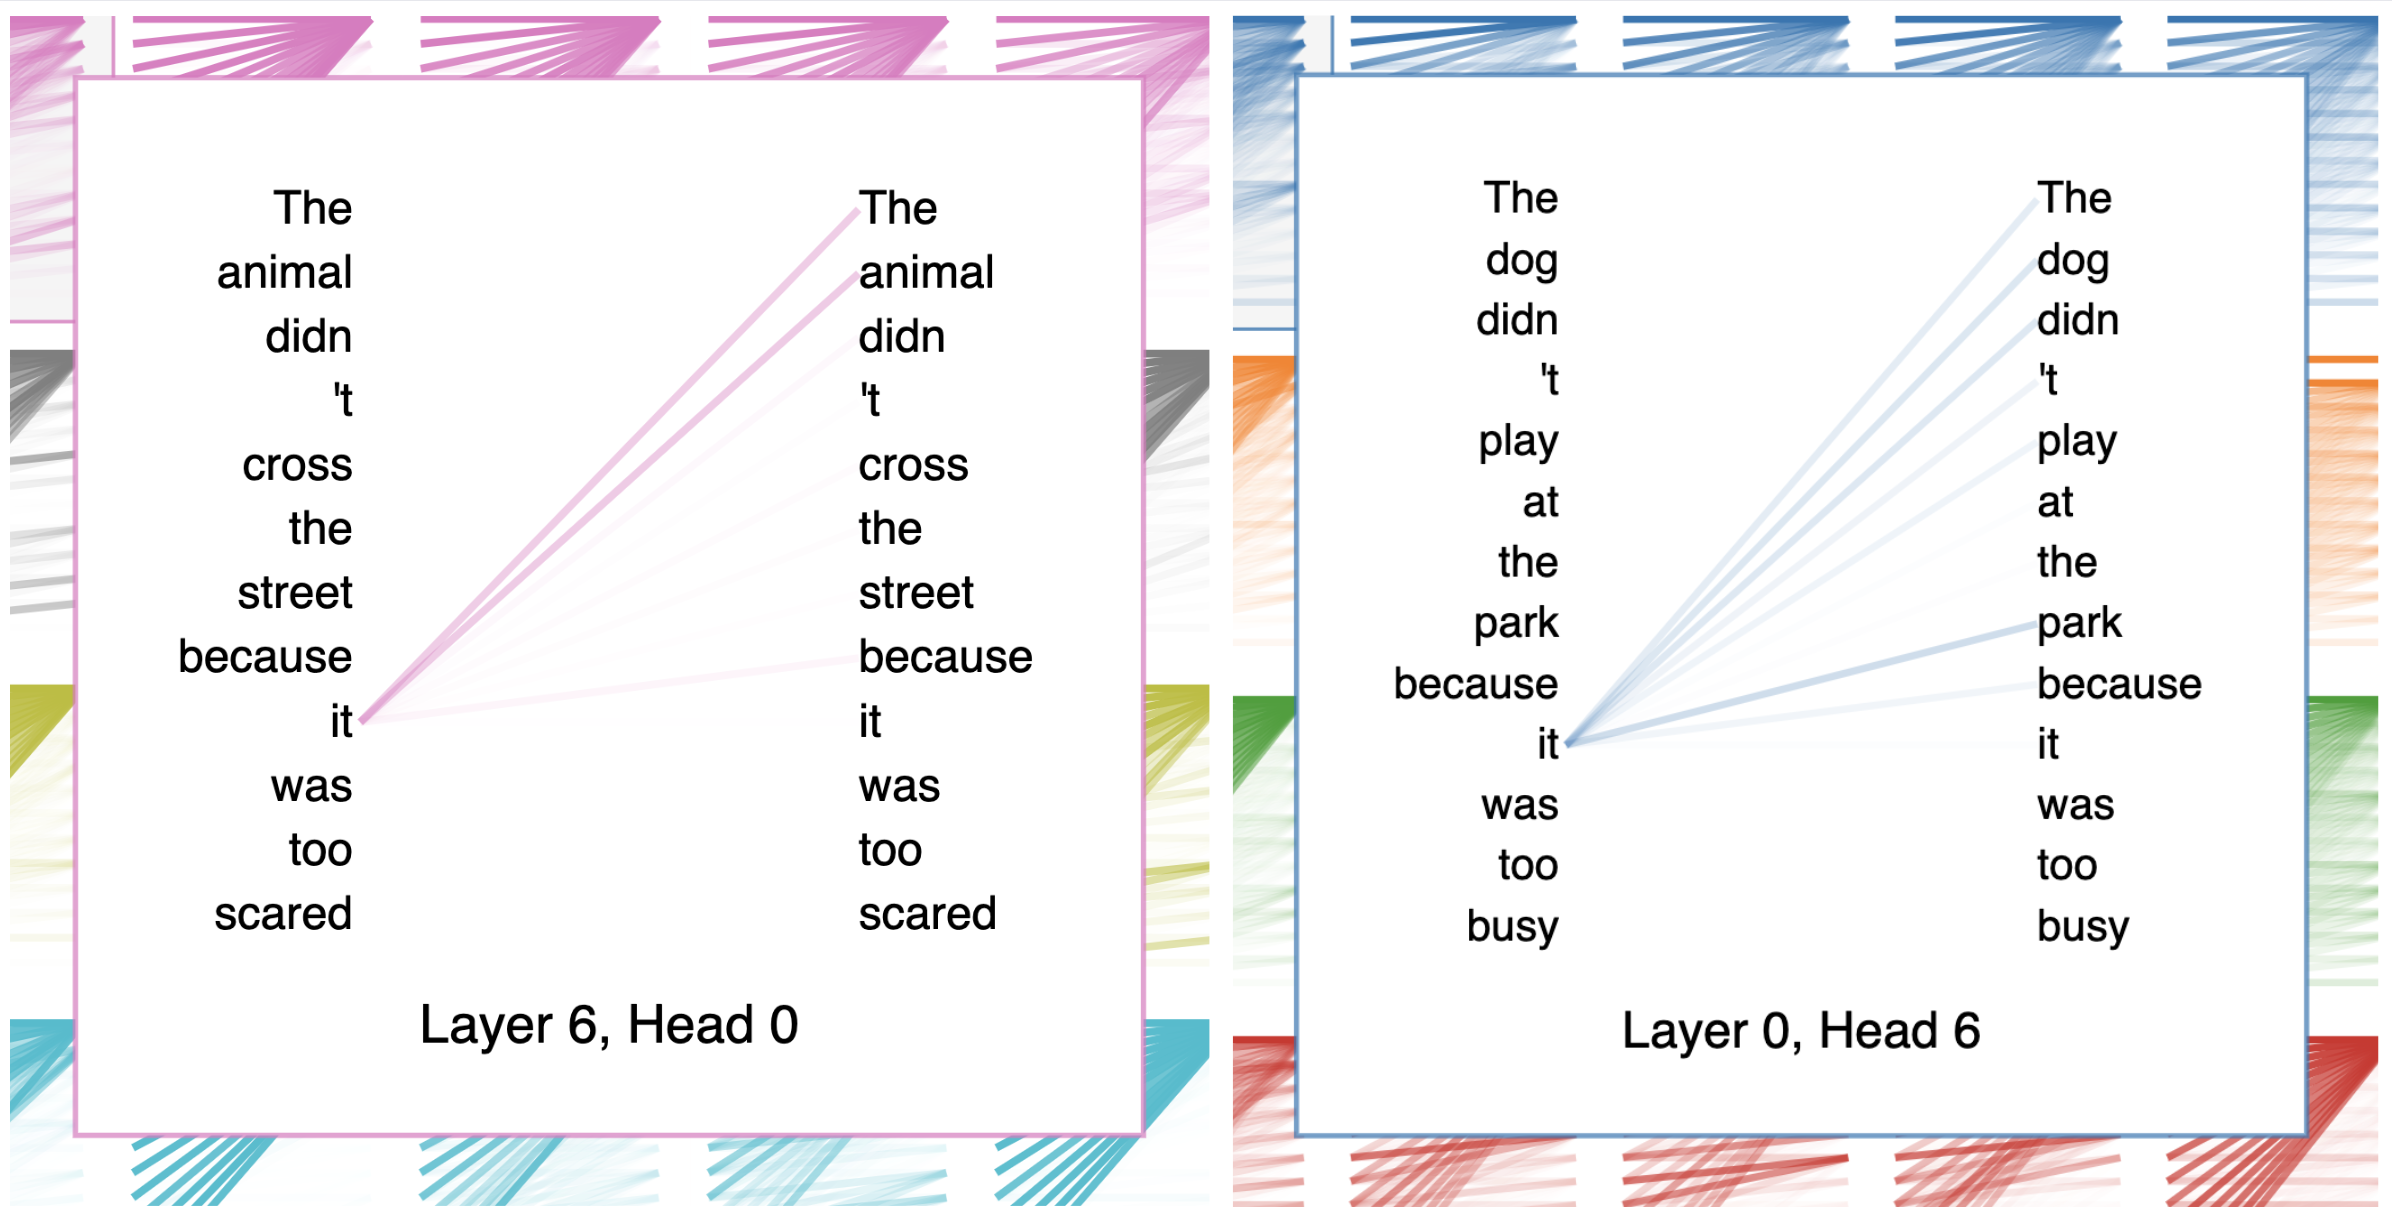
In the image below, we use the same example from earlier in the tutorial (left). On the right, a slightly different version of the sentence. In both cases, GPT-2 generated the last word in the sentence. At first, it may seem silly to think the dog had too many plans to go to the park. But examining the attention heads shows us the model was probably referring to the “park” as “too busy.”
Explainability in AI
As AI becomes more advanced, model calculations can become nearly impossible to interpret, even by the engineers and researchers that create them. This can lead to a whole host of unintended consequences, including, but not limited to: perpetuation of bias and stereotypes, distrust in organizational decision-making, and even legal ramifications. Explainable Artificial Intelligence (XAI) is a set of processes used to describe a model’s expected impact and potential biases. A commitment to XAI helps:
- Organizations adopt a responsible approach to AI development
- Developers ensure a model is working as expected and meets regulatory requirements
- Researchers characterize accuracy, fairness, and transparency for decision-making
- Organizations build trust and confidence
So how can practitioners incorporate XAI practices into their workflows, when the most popular ML architectures today– transformers– are notoriously opaque? The answer to this question isn’t simple, and explainability must be approached from many different angles. But we hope this tutorial gives you one more tool in your XAI tool box by helping you visualize attention in transformers.
Conclusion
Thanks for making it all the way to the end, and we hope you enjoyed this article. Feel free to connect with us on our Community Slack channel with any questions, comments, or suggestions!
Additional Resources
- The Illustrated Transformer
- The Illustrated BERT
- Deconstructing BERT part 1
- Deconstructing BERT part 2
- A Multi-scale Visualization of Attention in the Transformer Model
- BertViz: A Tool For Visualizing Multi-Head Self-Attention in the BERT Model
- Stanford’s CS25: Introduction to Transformers with Andrej Karpathy
- Stanford’s CS25: Transformers in Language with Mark Chen
- DeepLearning AI’s Natural Language Processing Specialization
- Natural Language Processing with PyTorch by Delip Rao, Brian McMahan

